We all know the struggle: You have great data, but designing the visual takes hours. Or worse, you try to use image generators, but the text comes out as alien gibberish.
Enter the new era of Gemini (codenamed "Nano Banana Pro").
The text rendering capability in this model is a massive leap forward. Unlike previous AI models, Gemini is grounded in search data and understands typography, allowing you to create usable, editable infographics instantly.
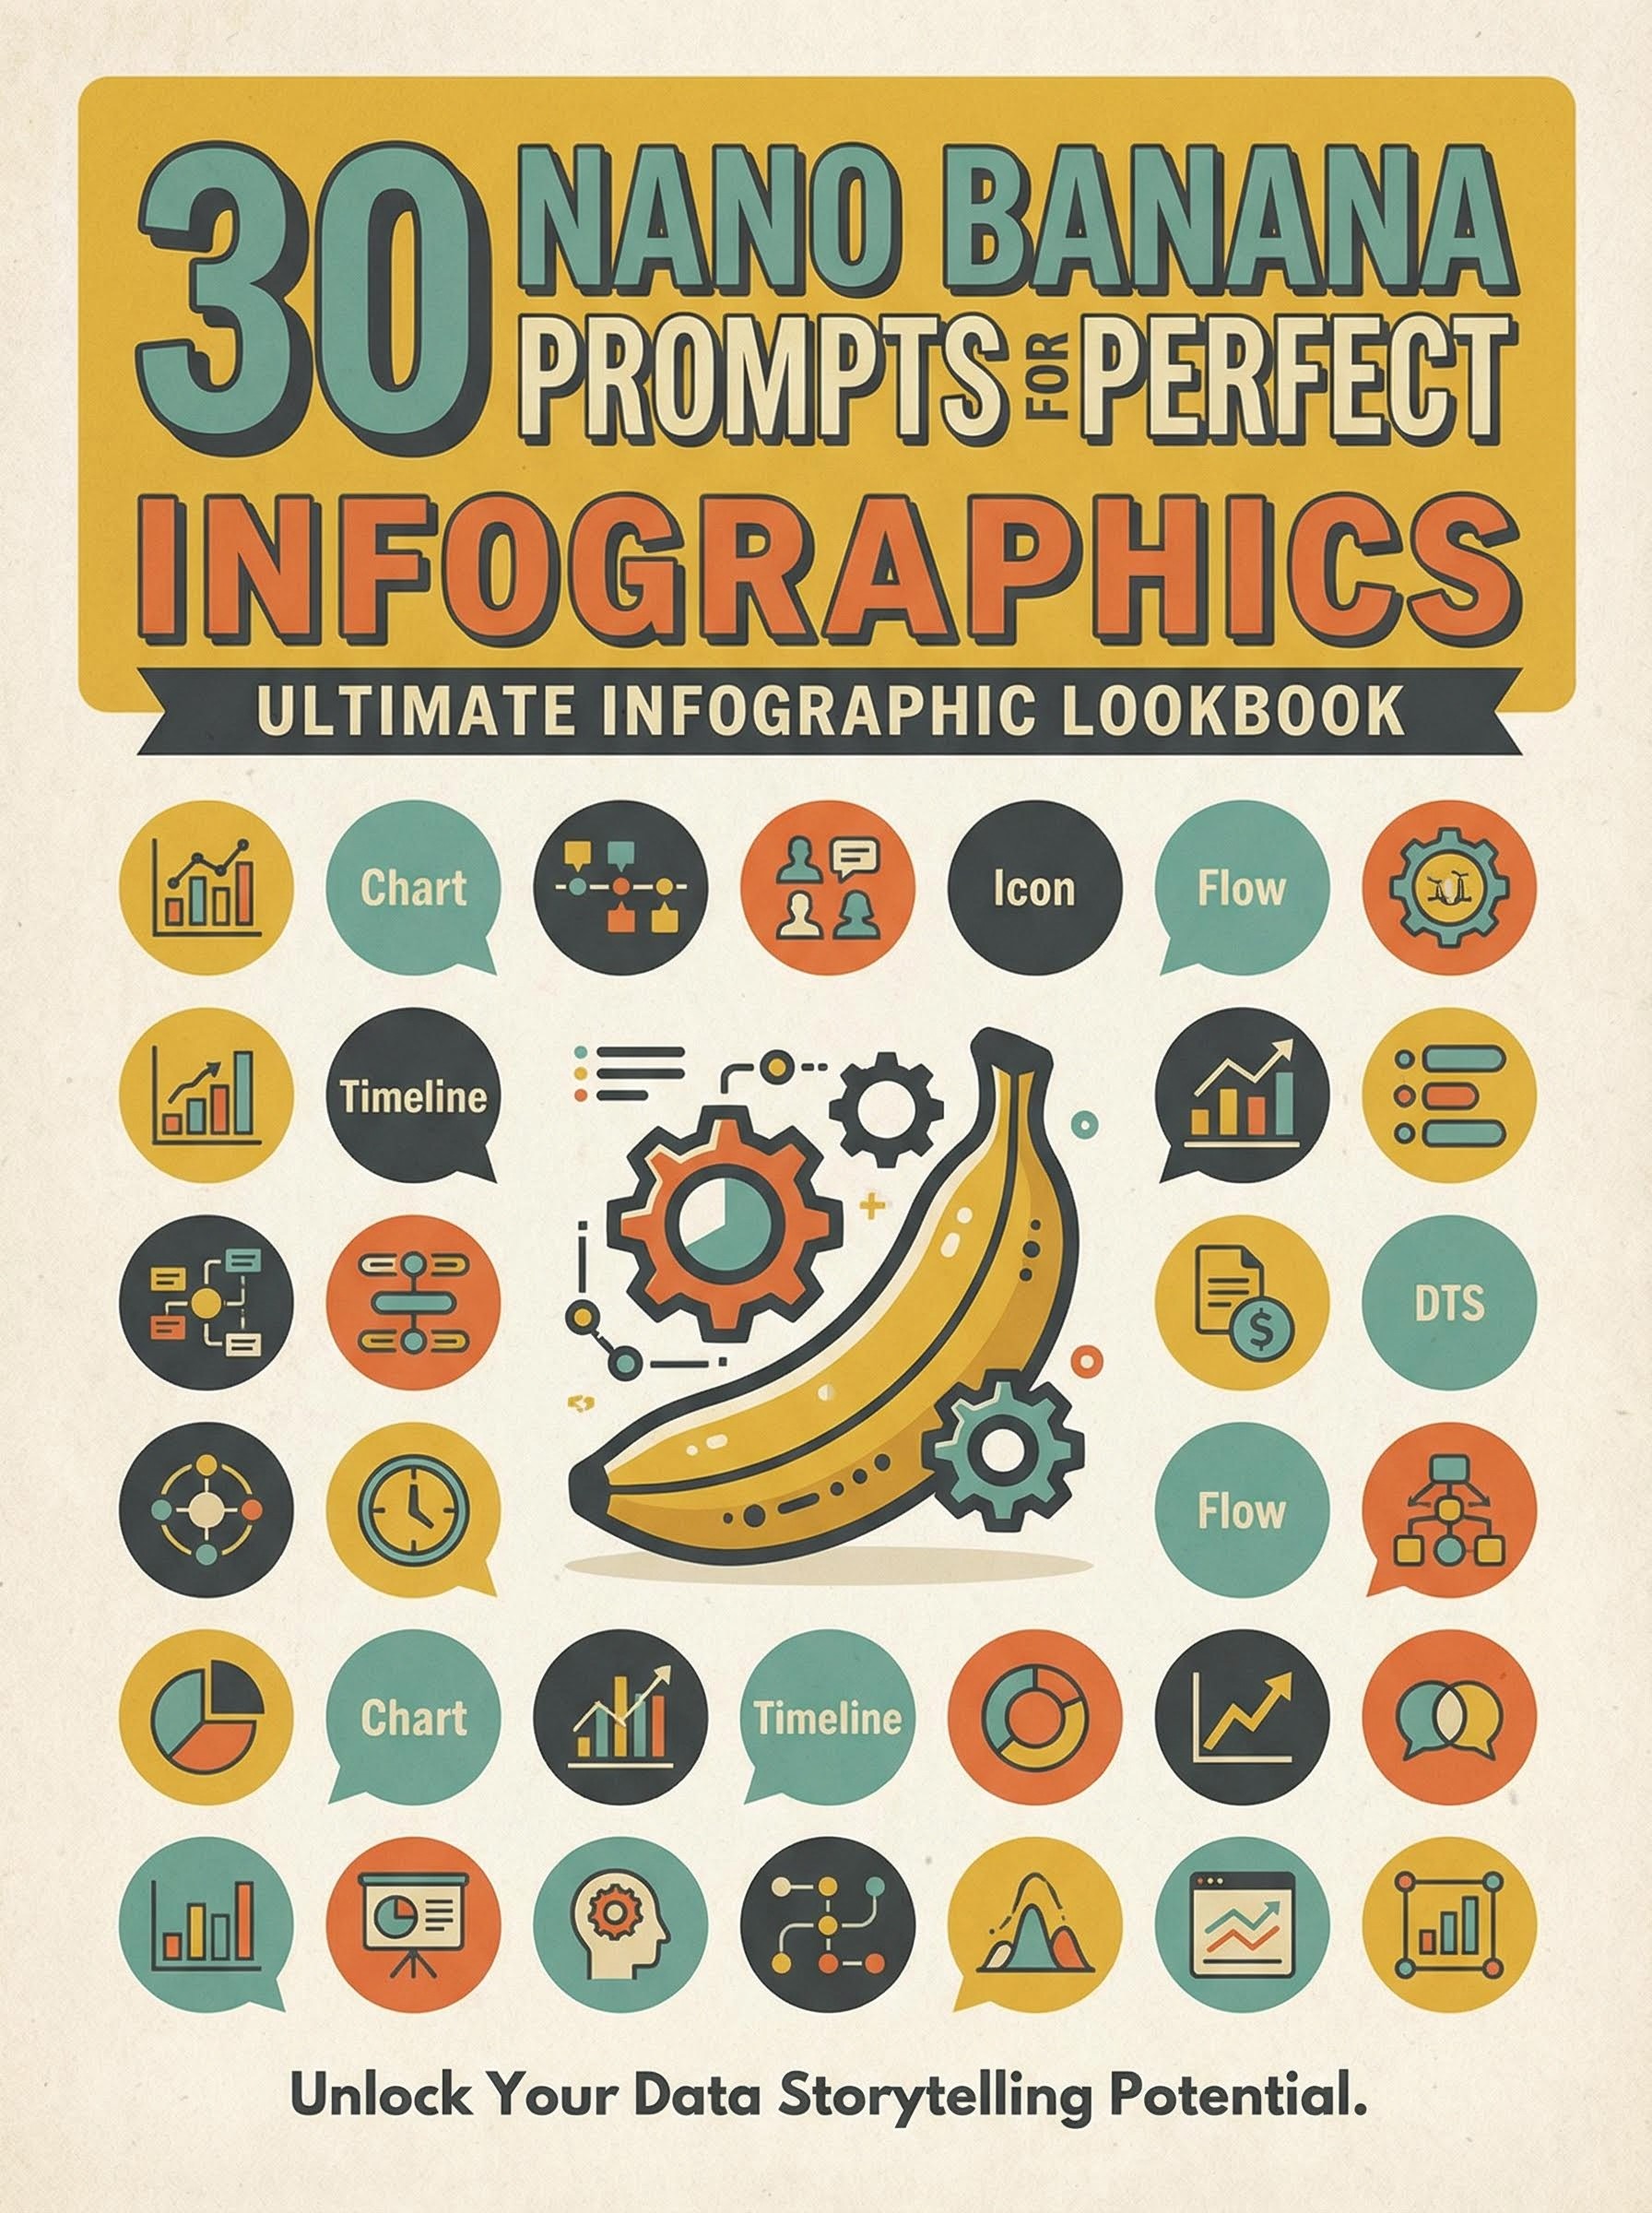
At Atlabs AI, we’ve stress-tested the model to bring you this curated "Infographic Lookbook." Below are 30 specific prompts broken down by style. These aren't just "make a chart" commands; they include style modifiers, layout logic, and design terminology to force the model to output professional results.
How to use these prompts:
Copy the code block text below.
Replace the [BRACKETED TEXT] with your specific topic.
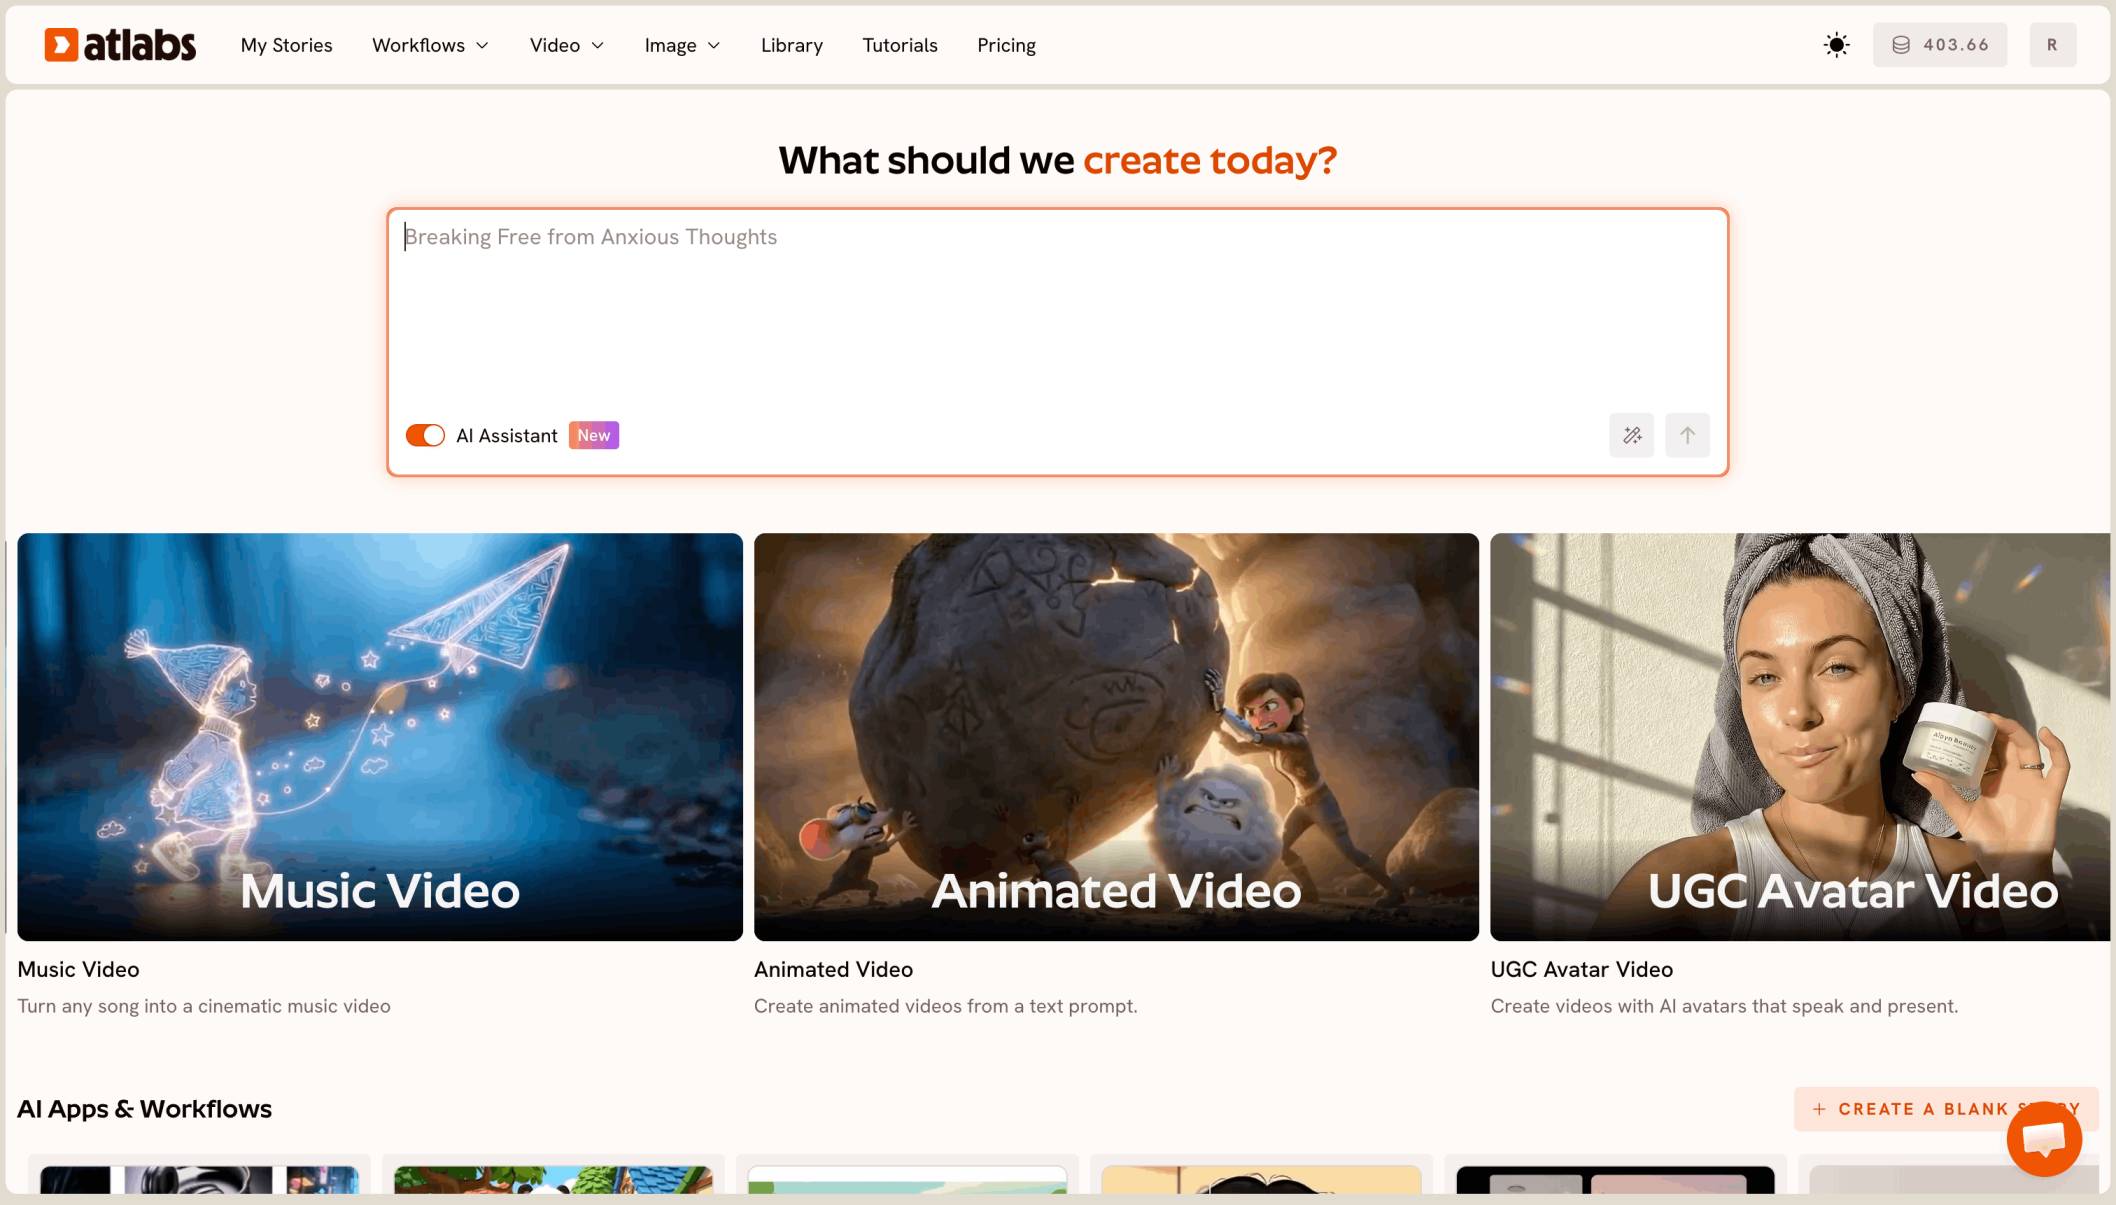
Go to Atlabs Image Generator.
Select Nano Banana Pro and the resolution
Click Generate
Cluster 1: The Corporate & Data Suite
Best for: Pitch decks, quarterly reports, and LinkedIn thought leadership.
Style: Clean, ample whitespace, Swiss design influence.
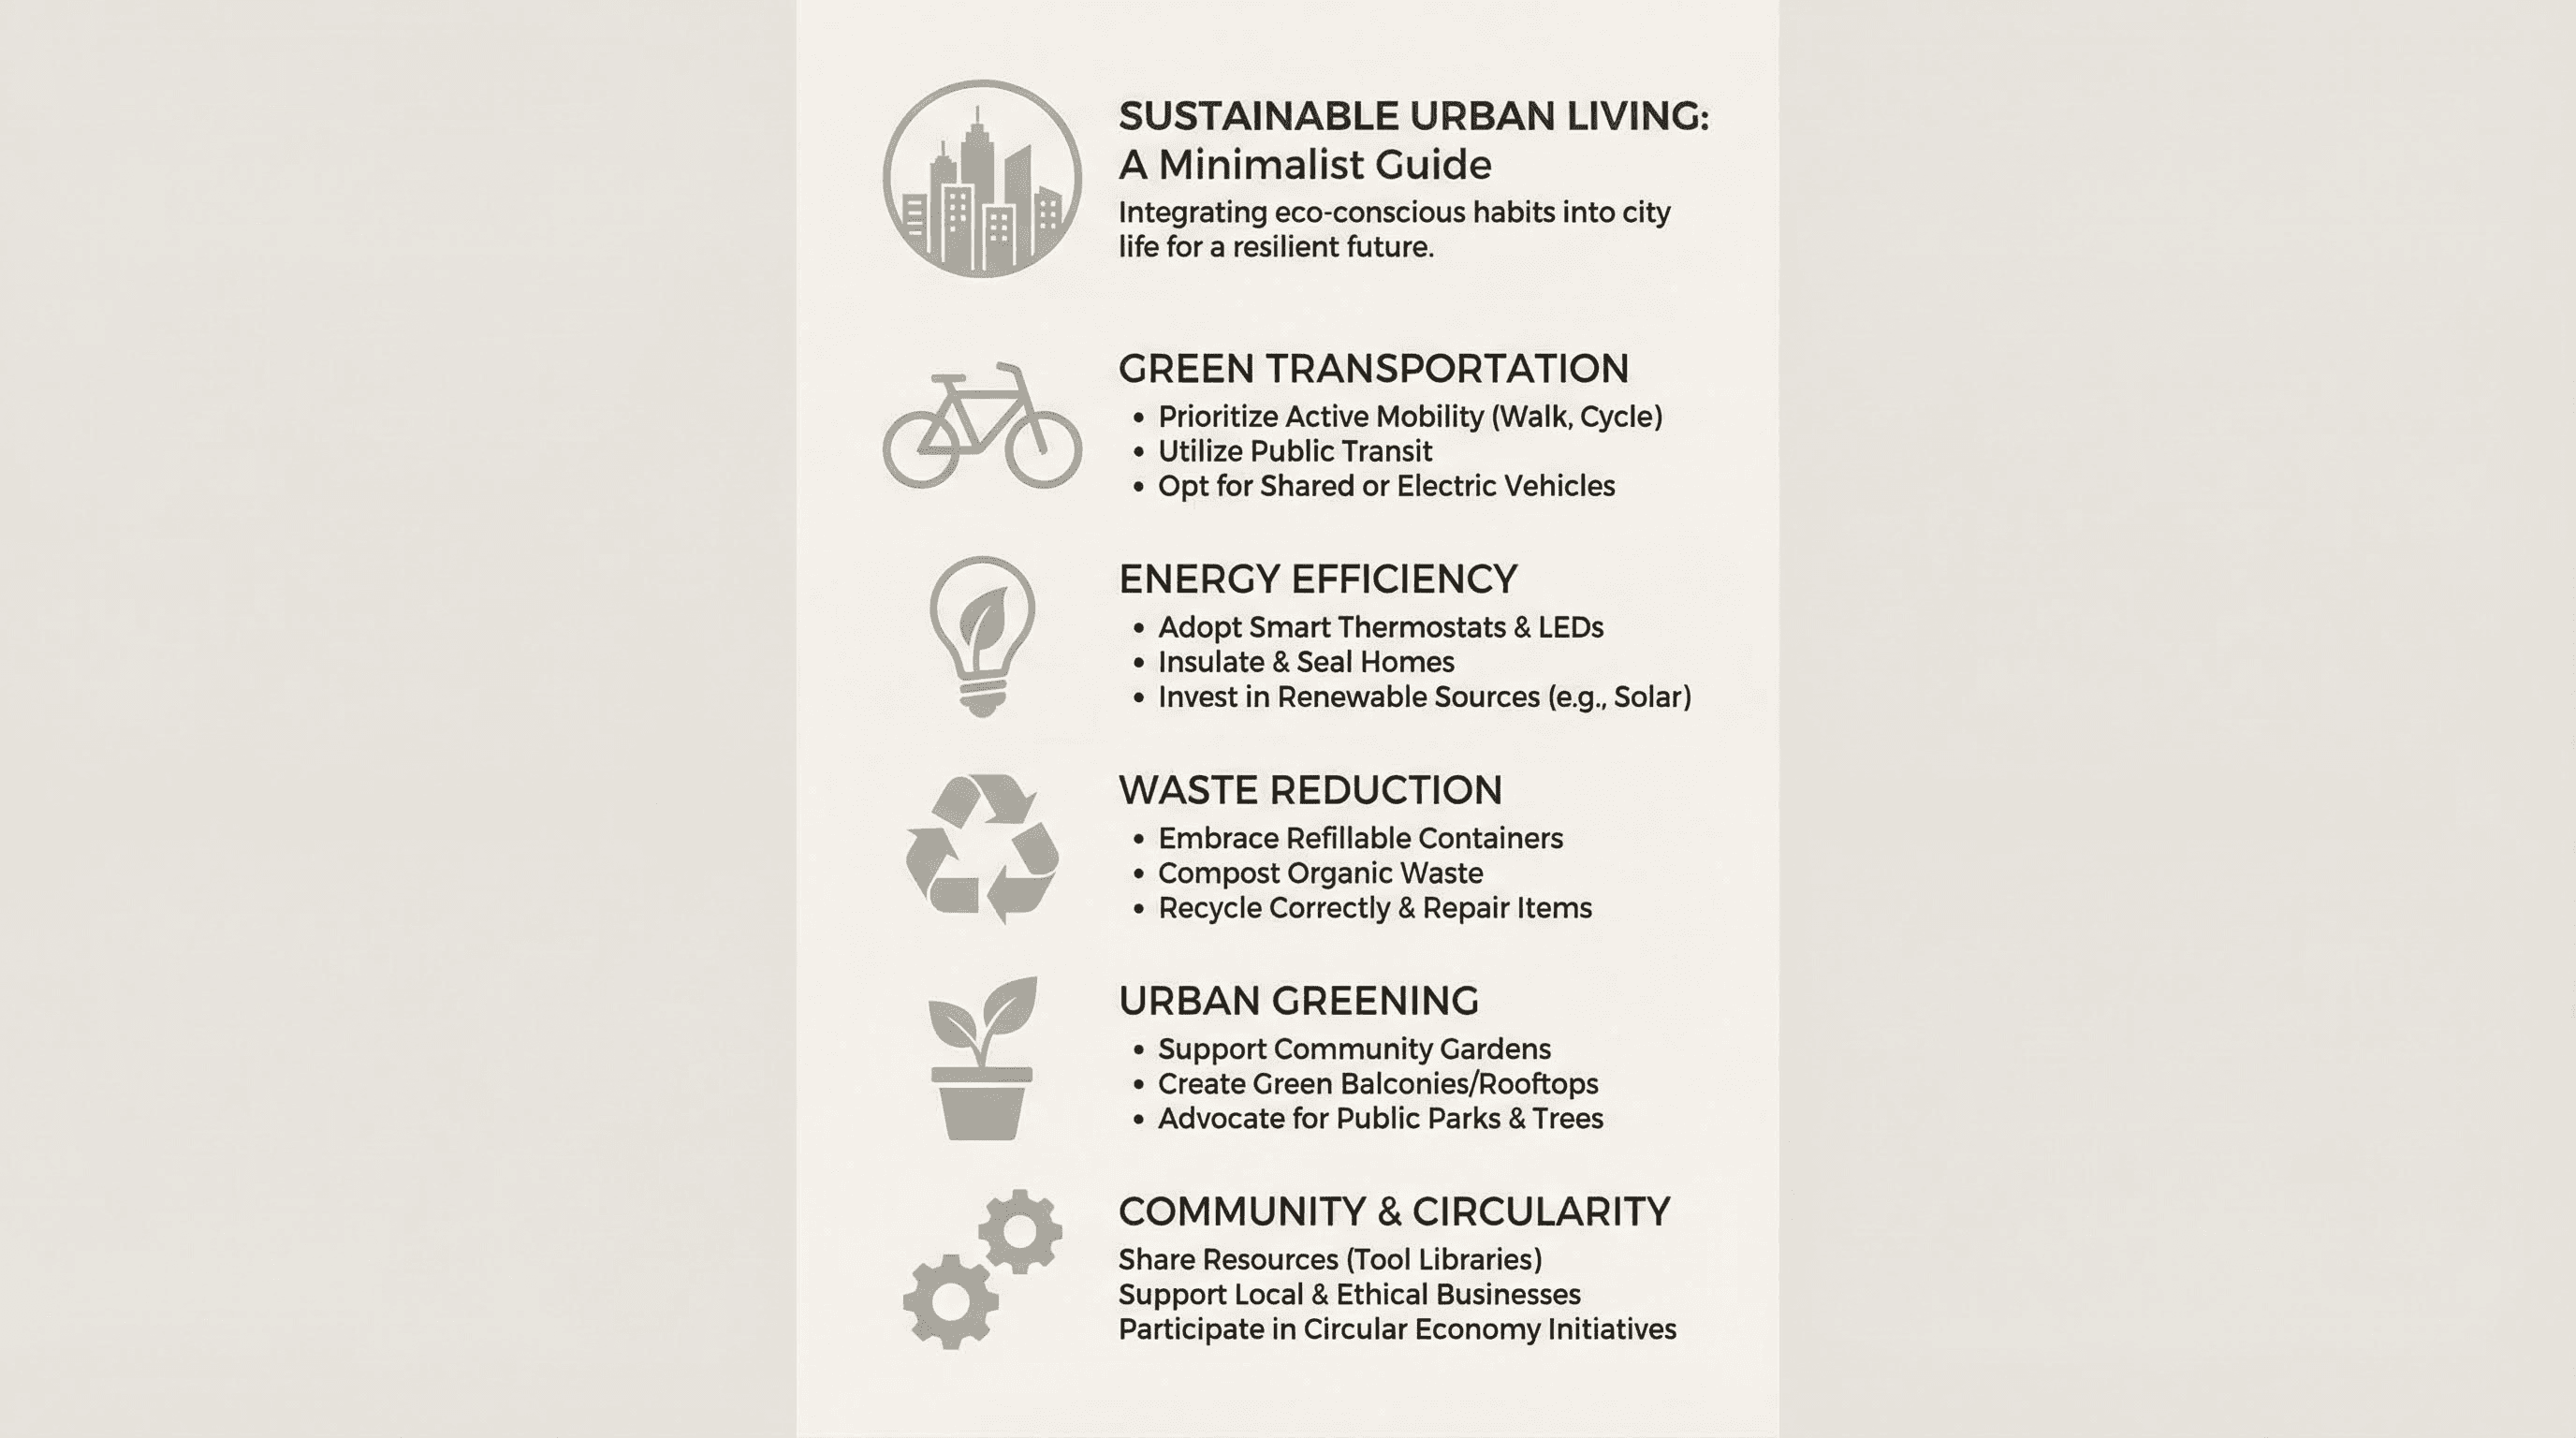
Create a vertical high-resolution infographic for [MAIN TOPIC]. Style: Clean Minimalist. Layout: 4 to 6 distinct data sections with clear hierarchy. Visuals: Simple sans-serif typography (Helvetica style), soft neutral background, monochromatic icons. No clutter, no gradients. Focus on negative space and alignment. Render text labels clearly.
Style: SaaS dashboard, dark UI, high contrast.
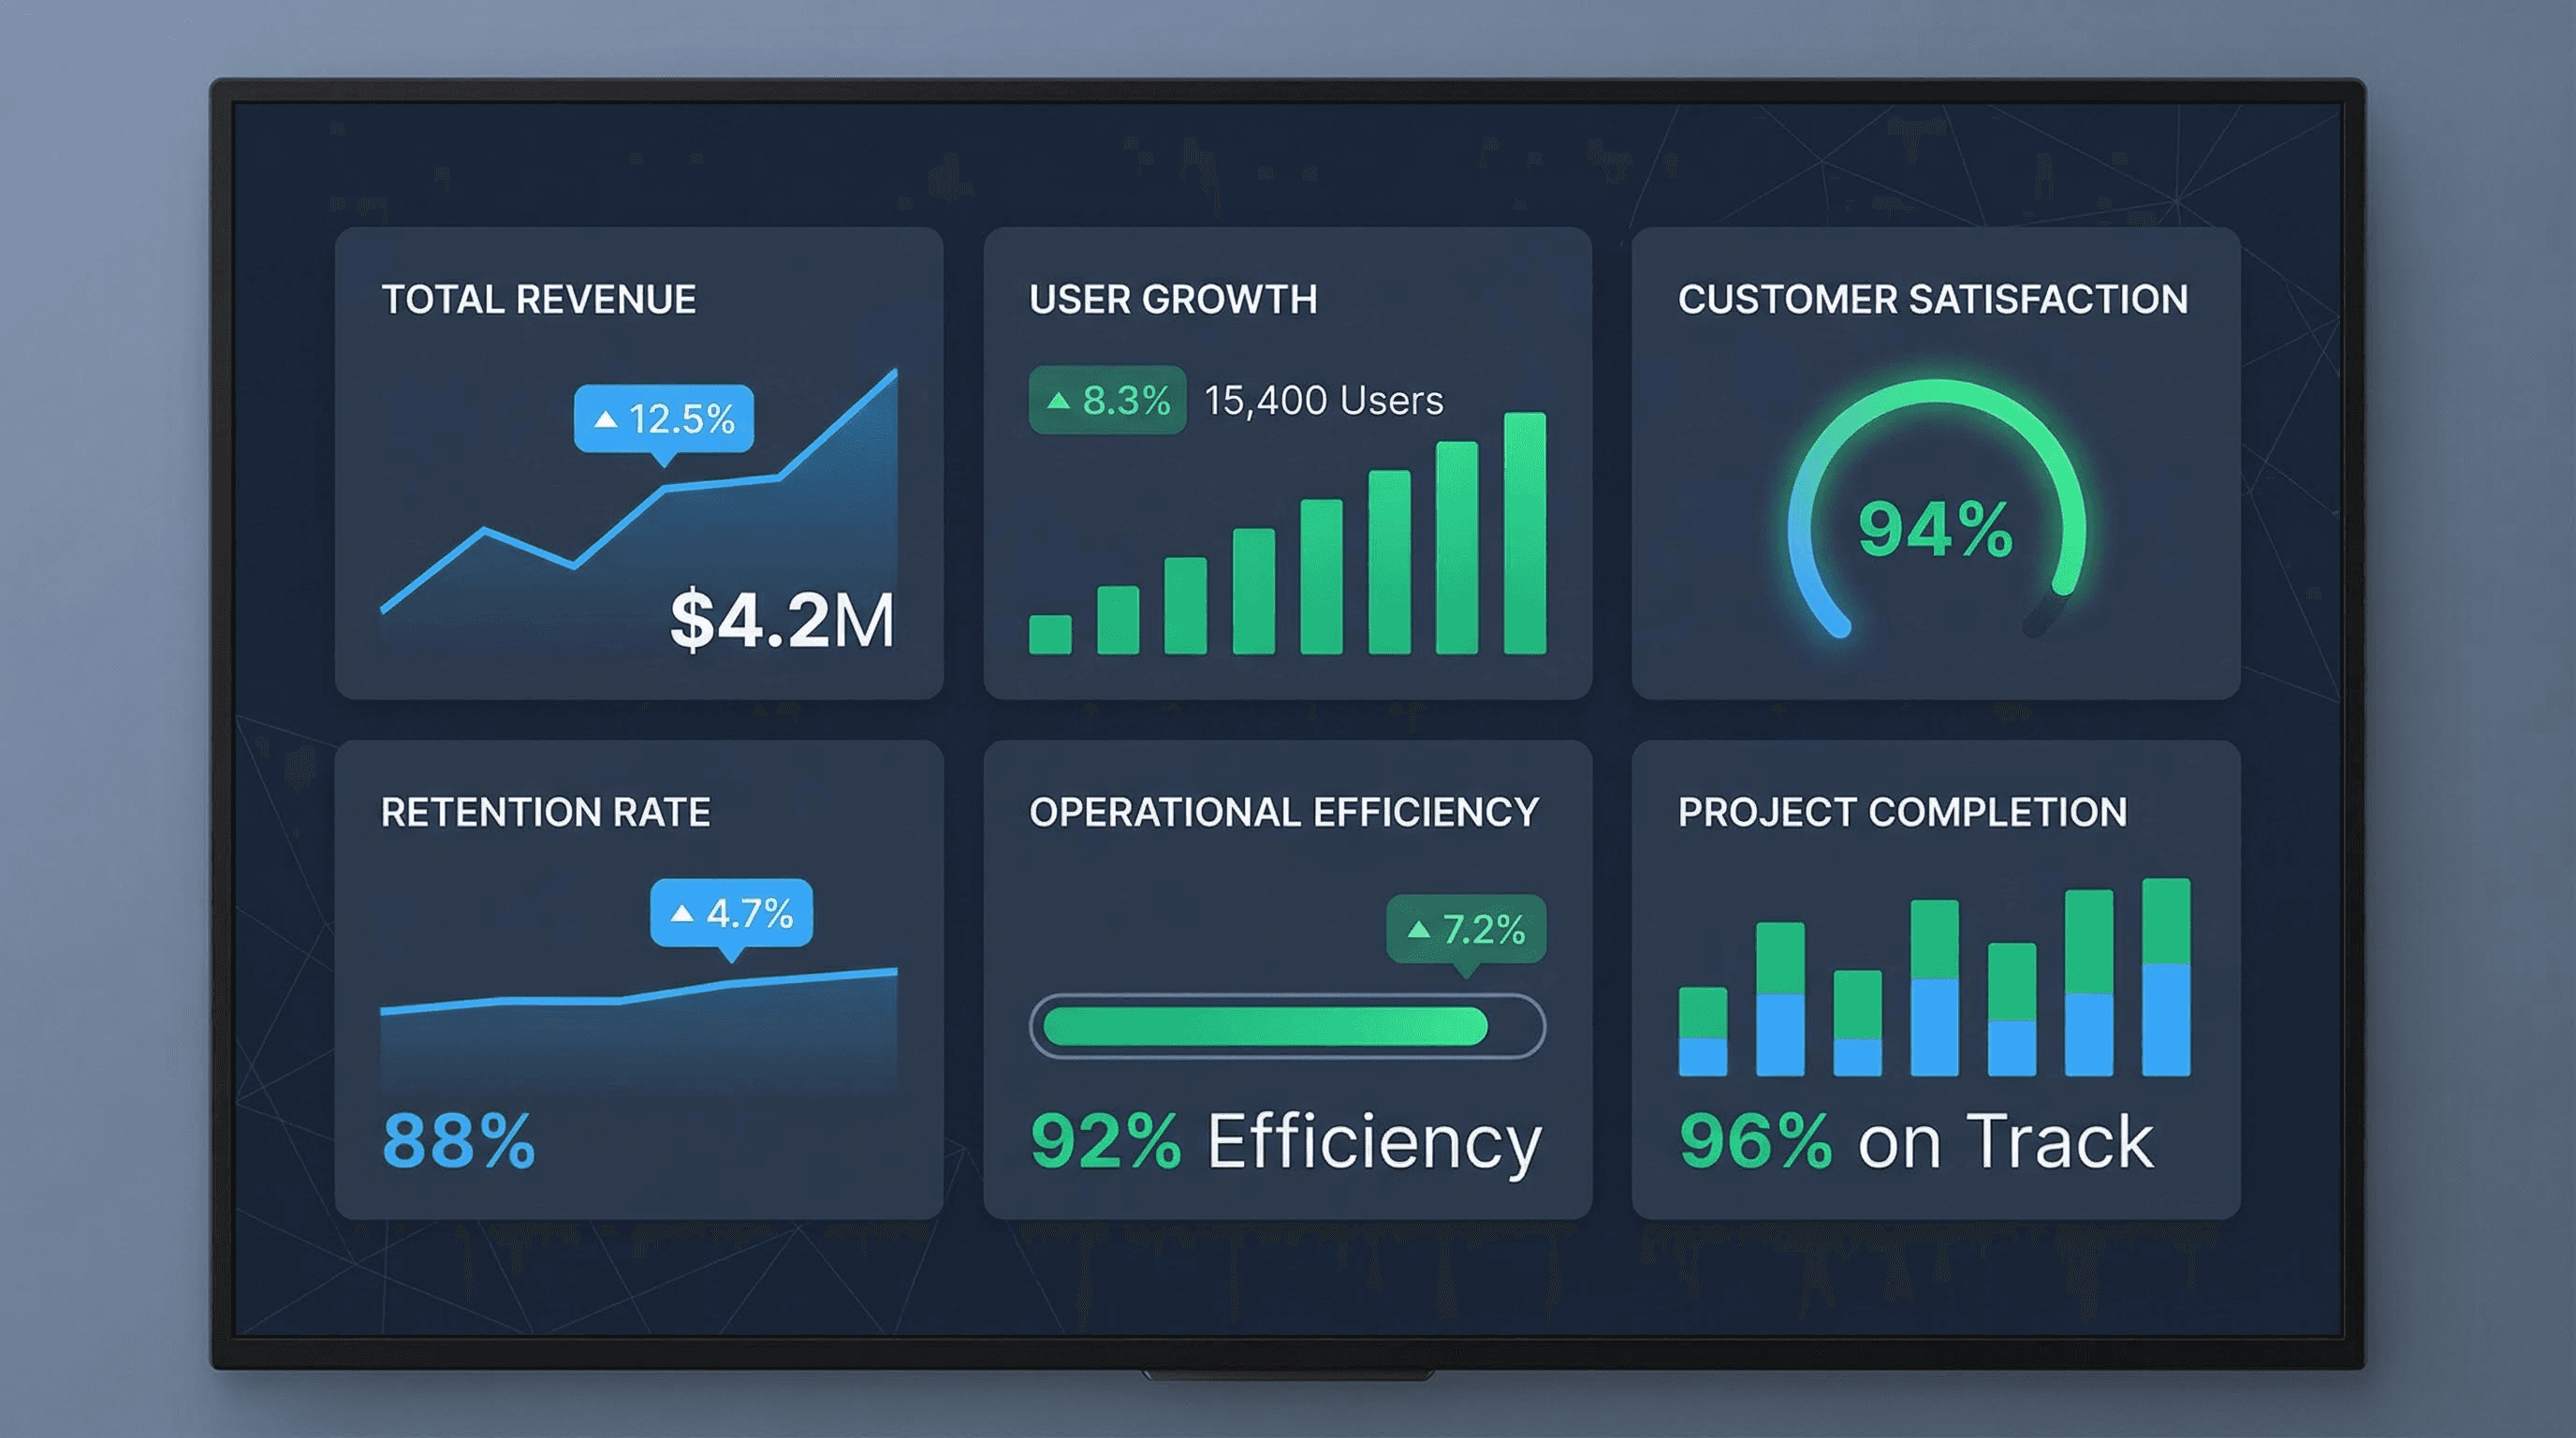
Design a corporate-style KPI dashboard infographic for [METRICS TOPIC]. Layout: Grid-based dashboard with 6 key metric cards. Visuals: Flat design, simple bar charts and line graphs. Palette: Dark slate background with electric blue and emerald green accents. Typography: Roboto or Inter style, clean and legible. Include percentage callouts.
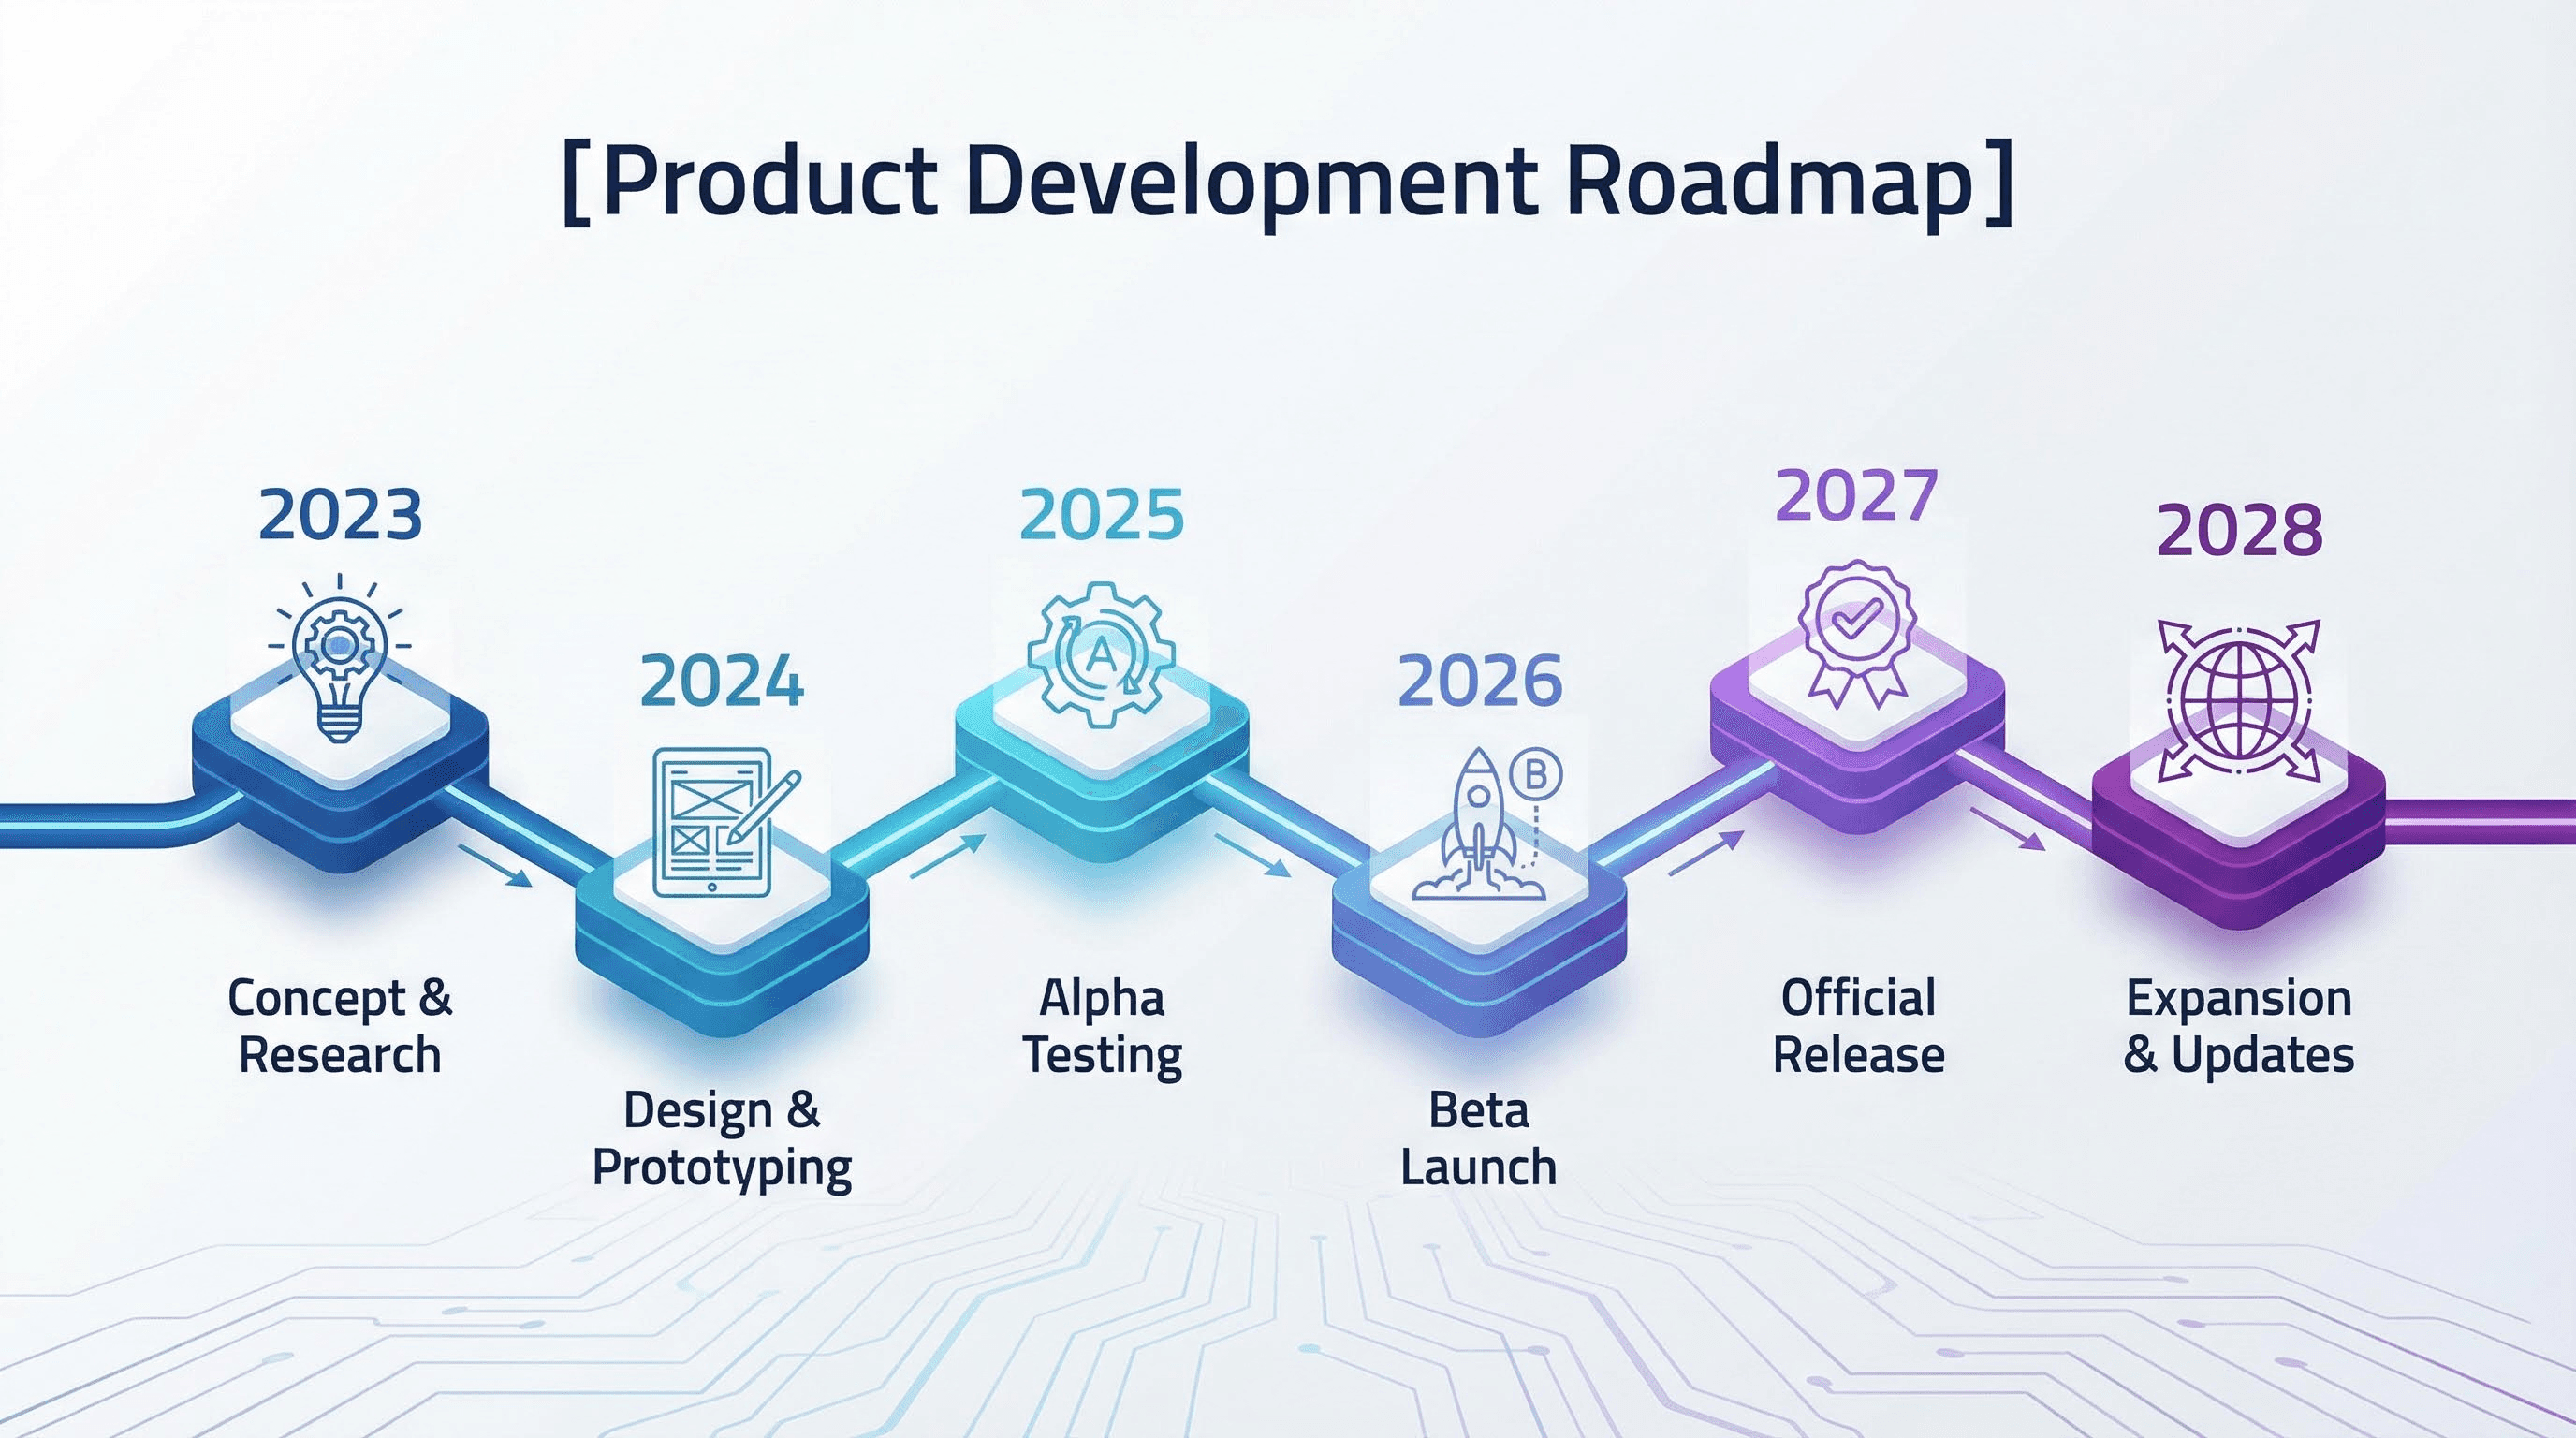
Style: Linear, progressive, milestone-based.
Generate a horizontal roadmap infographic for [TIMELINE TOPIC]. Layout: Linear progression line from left to right with 6 milestone nodes. Visuals: Isometric vector style, clean connectors. Each milestone features a unique icon and a year label. Palette: Professional gradation (Blue to Purple). High-definition vector art style.
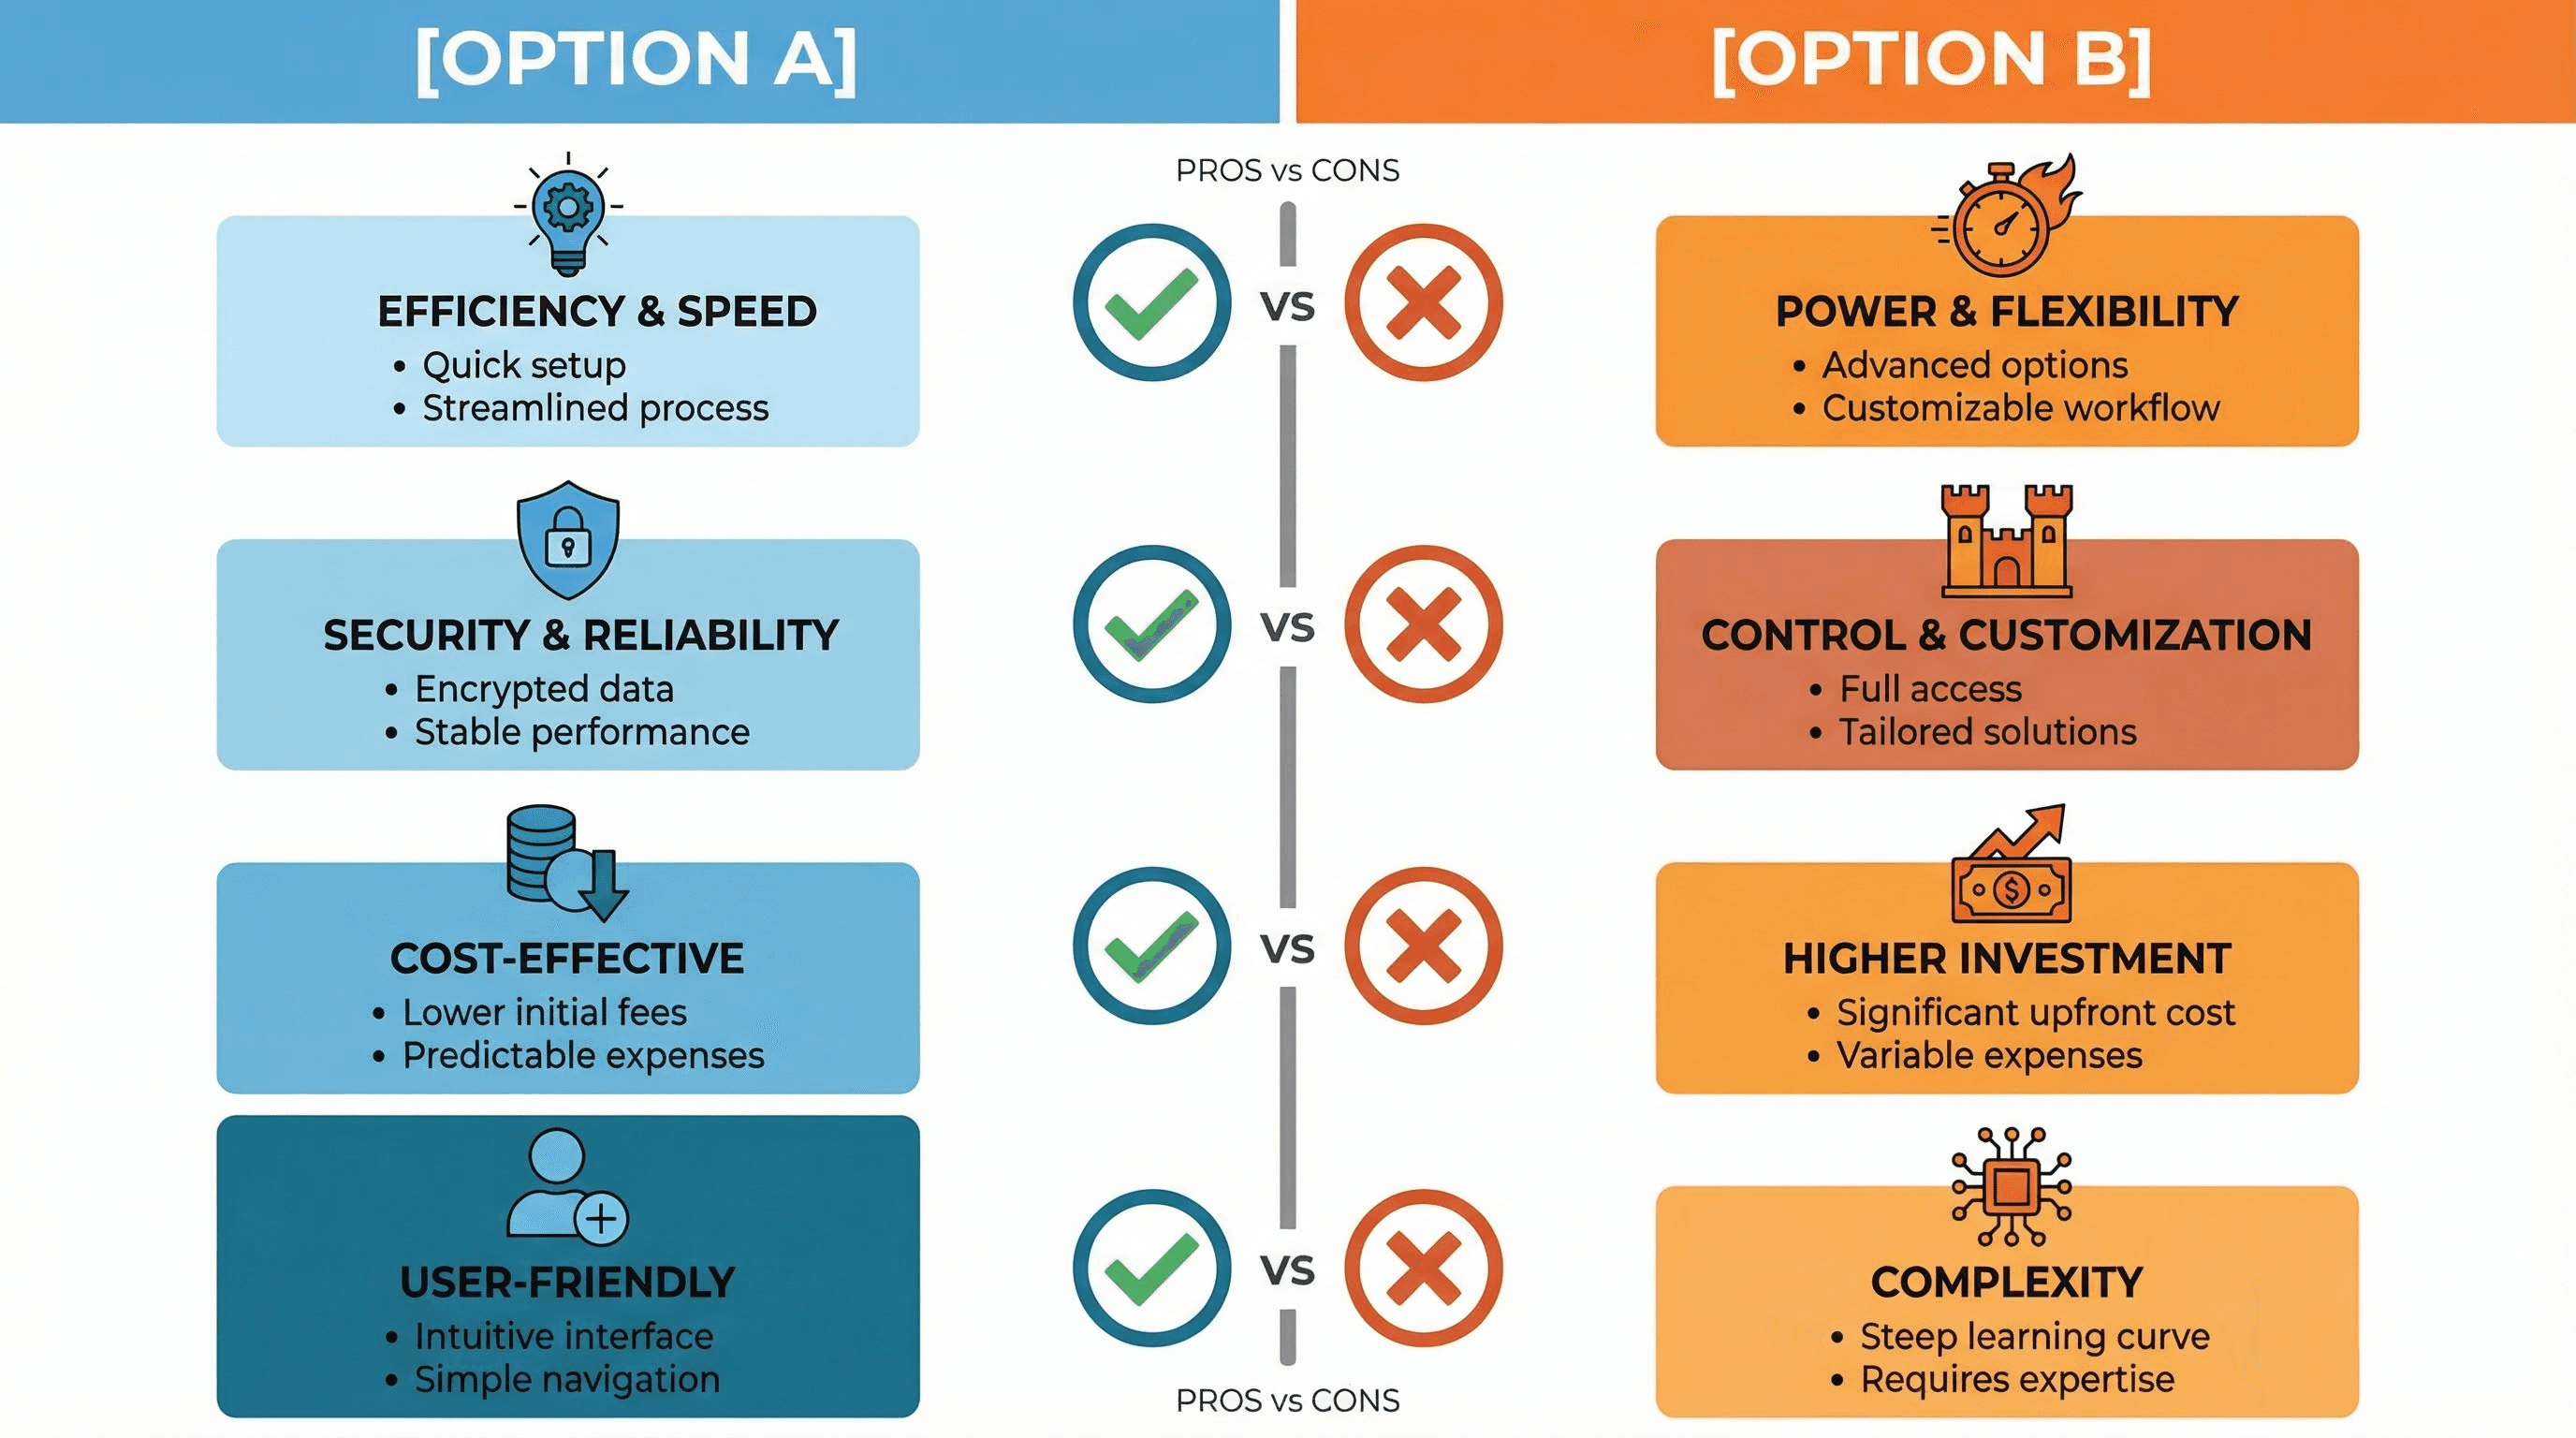
Style: Side-by-side battle, pros/cons.
Create a split-screen comparison infographic: [OPTION A] vs [OPTION B]. Layout: Symmetrical two-column grid. Visuals: Left side uses [COLOR A], Right side uses [COLOR B]. Center axis features comparison icons (Checkmarks vs X's). Style: Flat modern vector. Text alignment: Centered and strictly organized.
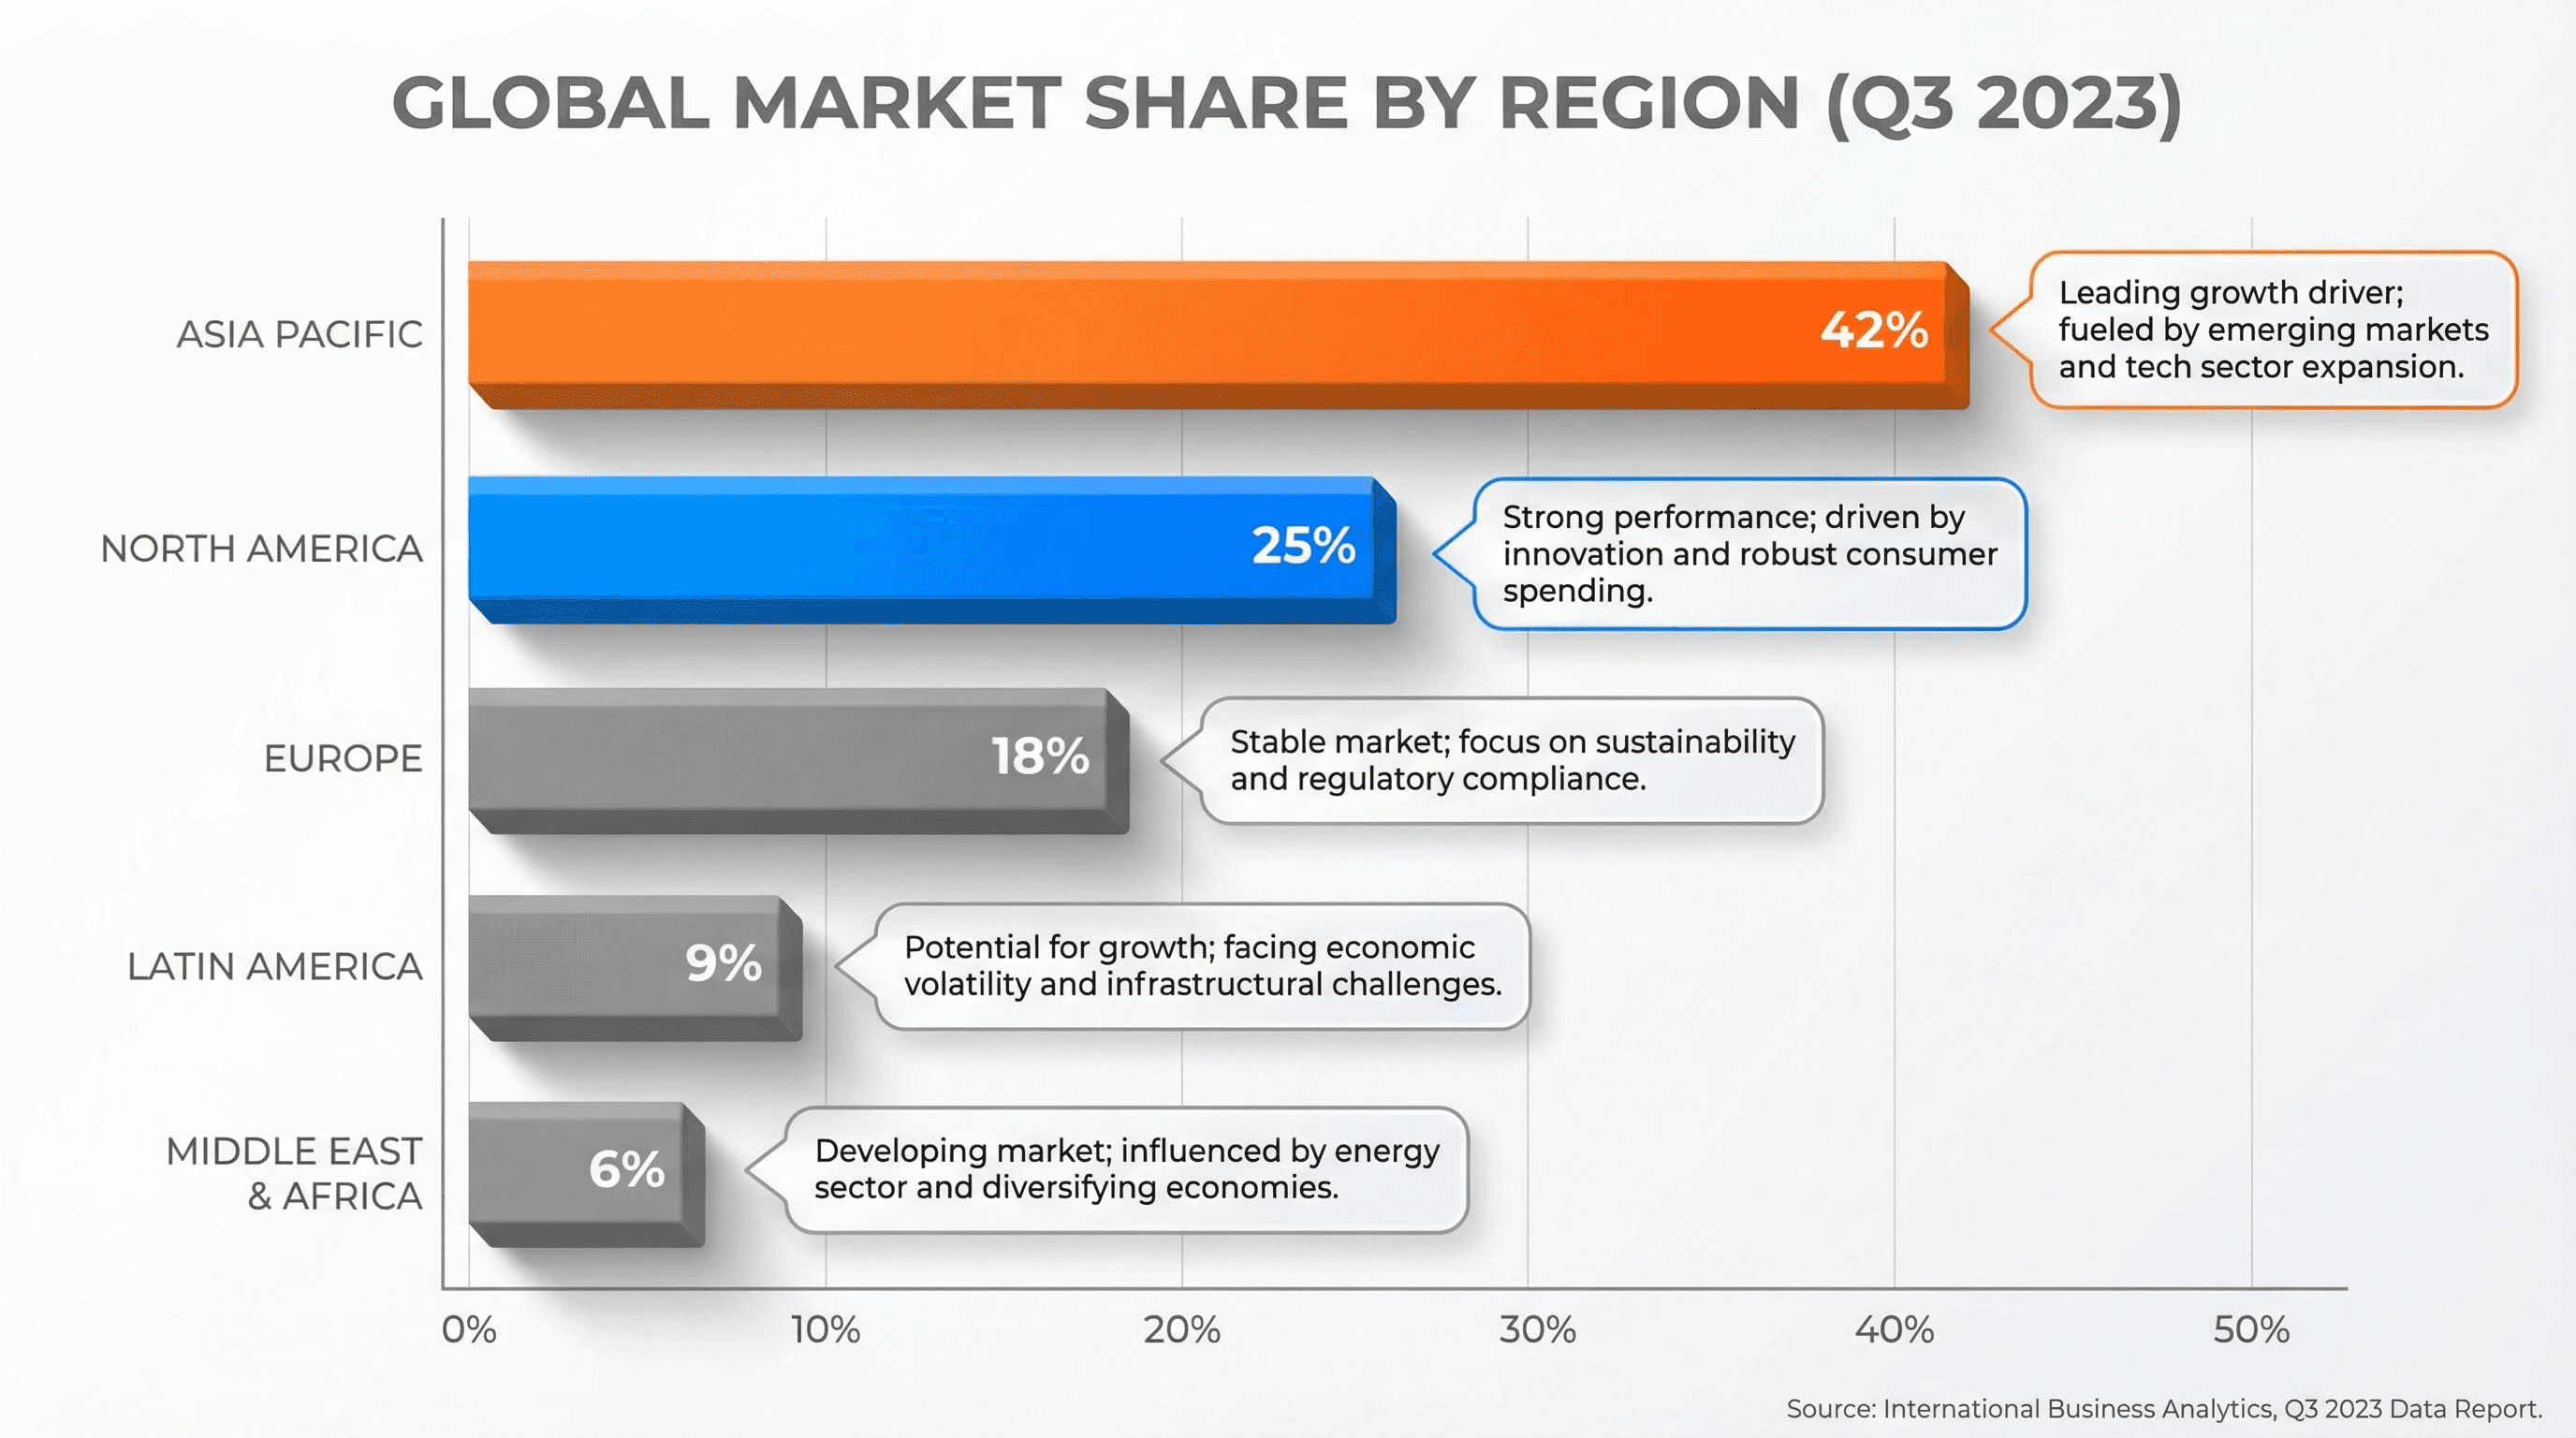
Style: Statistical, numeric, precise.
Design a professional bar chart infographic highlighting [DATA COMPARISON TOPIC]. Layout: Horizontal bars sorted descending. Visuals: 3D matte finish bars, soft shadows, clear axis lines. Annotations: floating text bubbles explaining key insights. Palette: White background, energetic accent colors for the top data points.
Cluster 2: The Editorial & Magazine Suite
Best for: Medium articles, newsletters, and viral social posts.
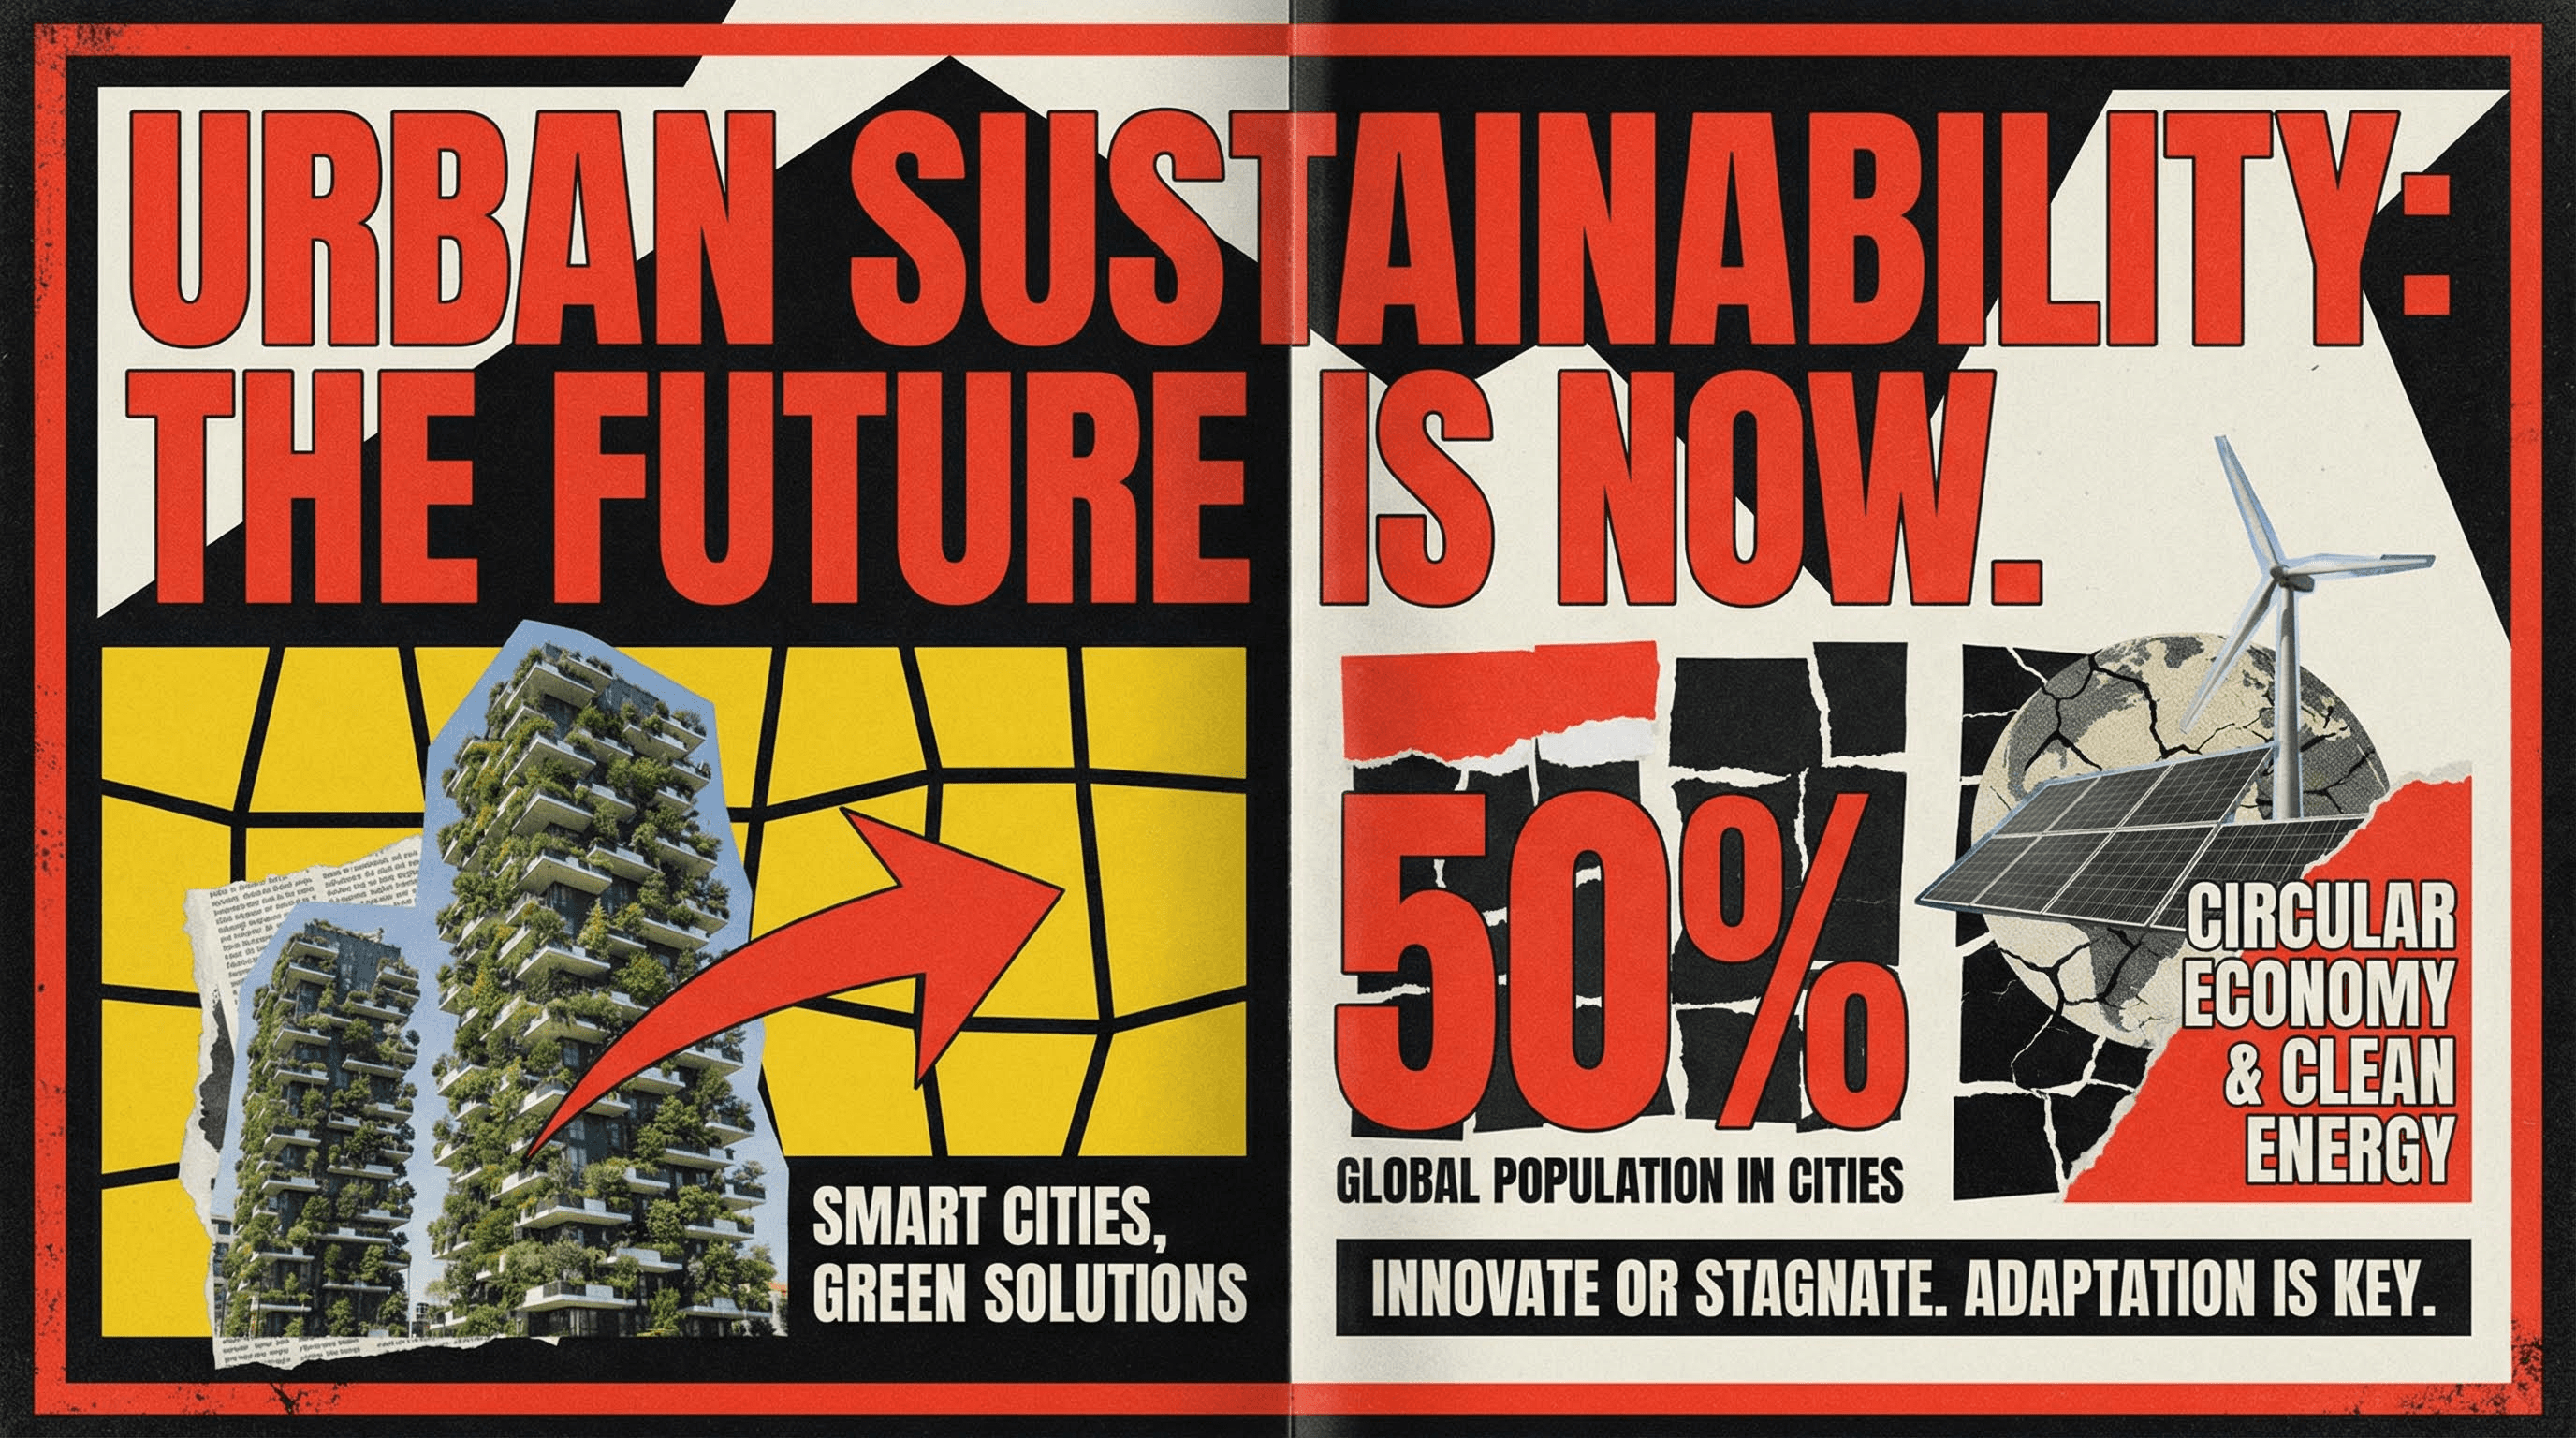
Style: Wired Magazine, Vox, high-impact journalism.
Design a bold editorial feature infographic about [MAIN TOPIC]. Style: Magazine spread aesthetic. Visuals: Asymmetrical grid, massive typography for the headline, high-contrast color blocks (Yellow/Black or Red/White). Incorporate collage-style elements and abstract shapes. Grainy texture overlay.
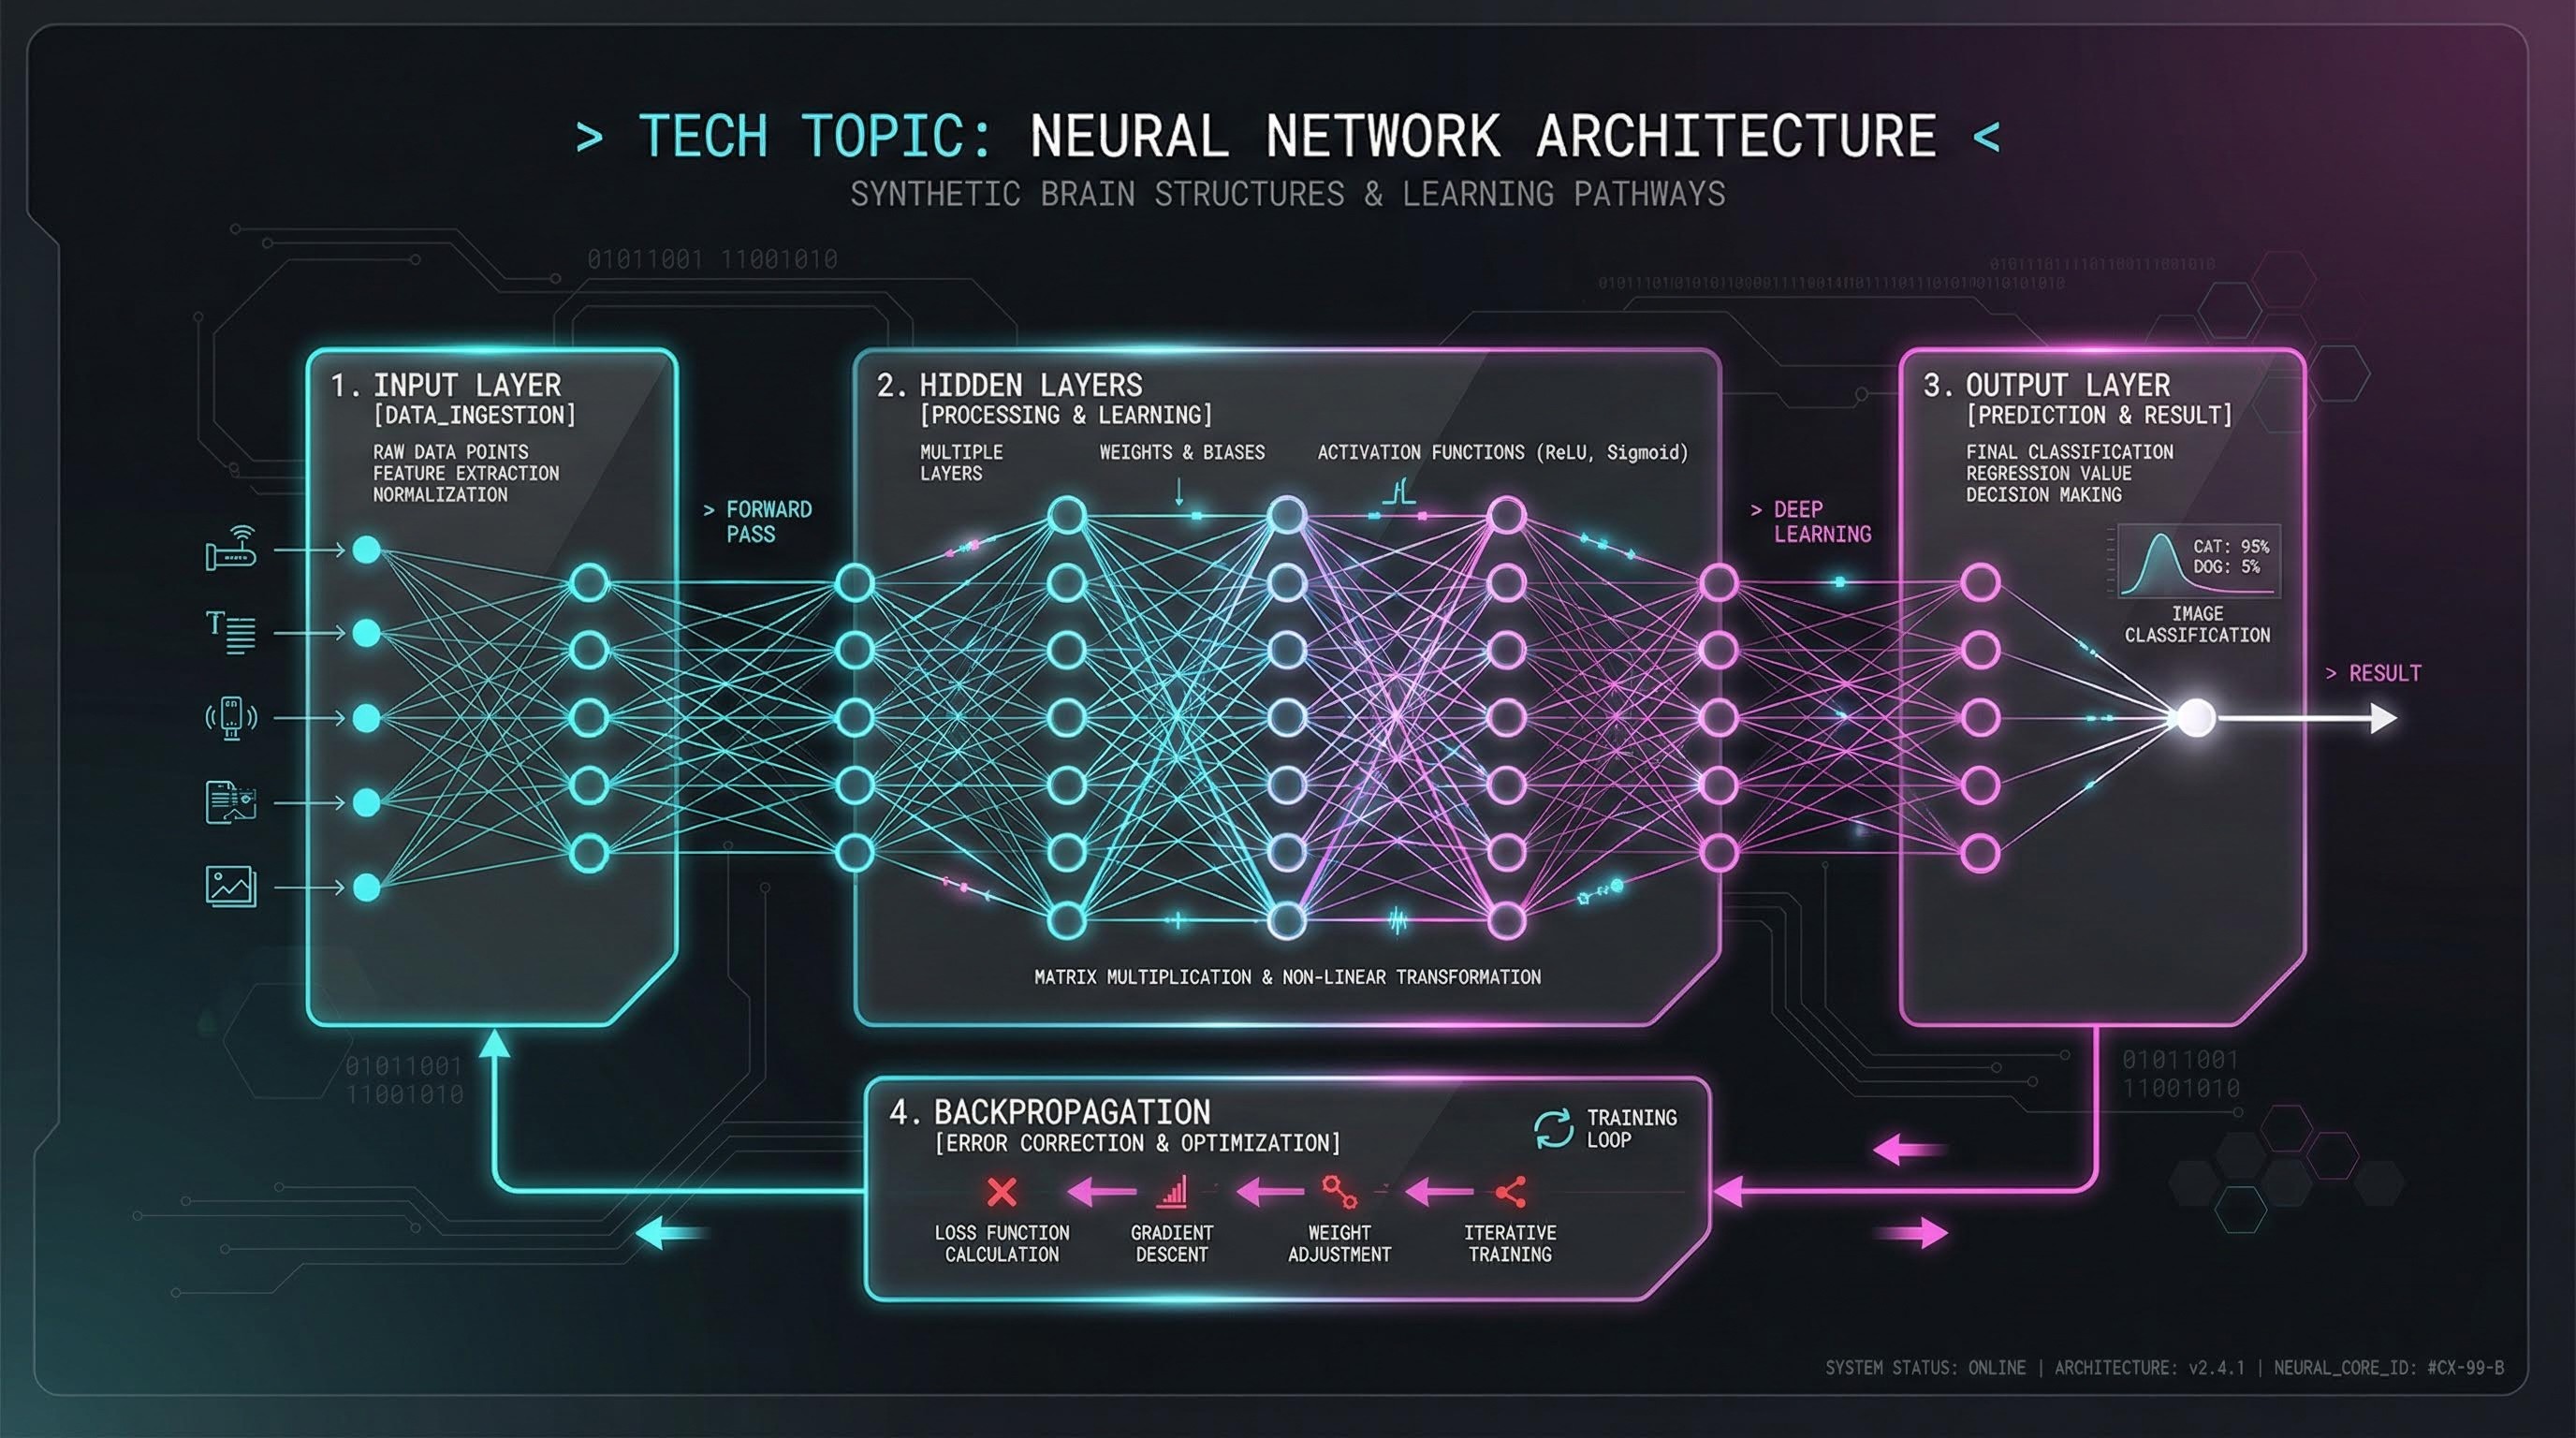
Style: Cyberpunk, crypto, developer focused.
Create a sleek Dark Mode infographic explaining [TECH TOPIC]. Style: Futuristic UI. Background: Deep black/charcoal. Accents: Neon Cyan and Magenta. Visuals: Glowing thin lines, glassmorphism effects on cards, monospaced coding fonts. Schematic technical drawing aesthetic.
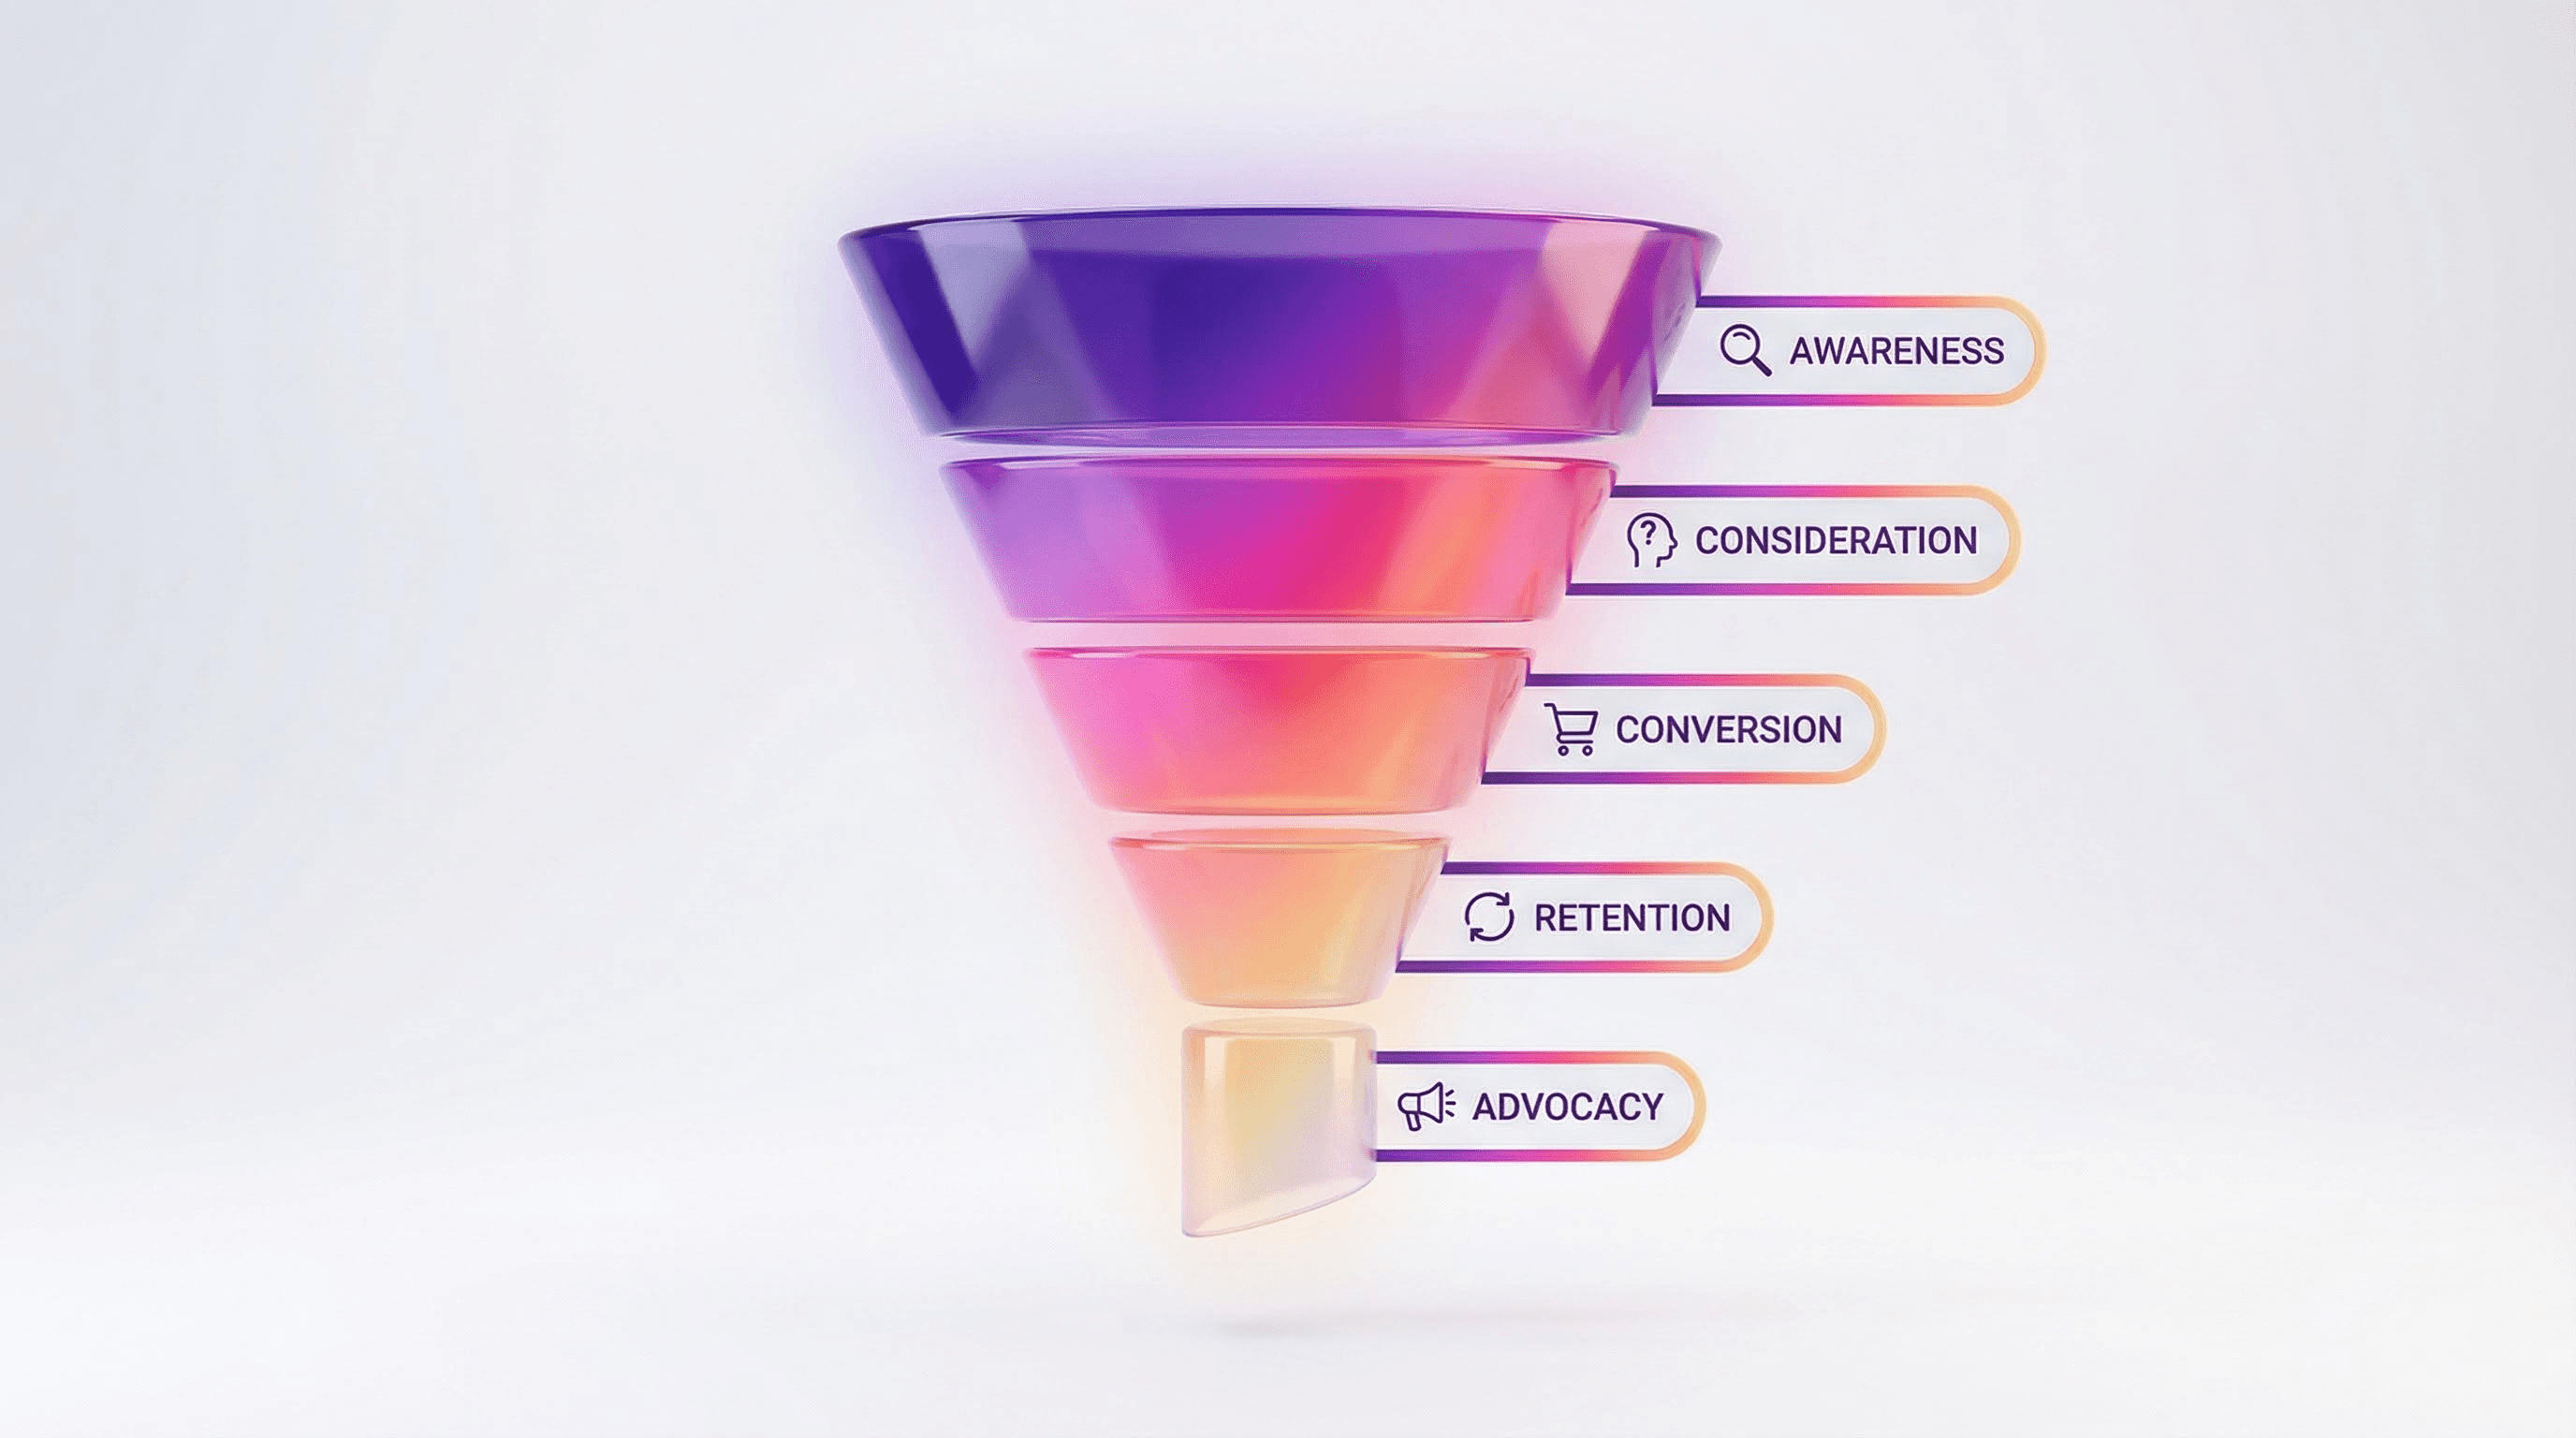
Style: Marketing, conversion, flow.
Generate a vertical funnel infographic for [FUNNEL TOPIC]. Visuals: A wide-to-narrow 3D funnel shape floating in center. Coloring: Smooth, modern mesh gradients (Instagram style brand colors). Layers: 5 distinct distinct sections with side-labels. High-gloss 3D render style.
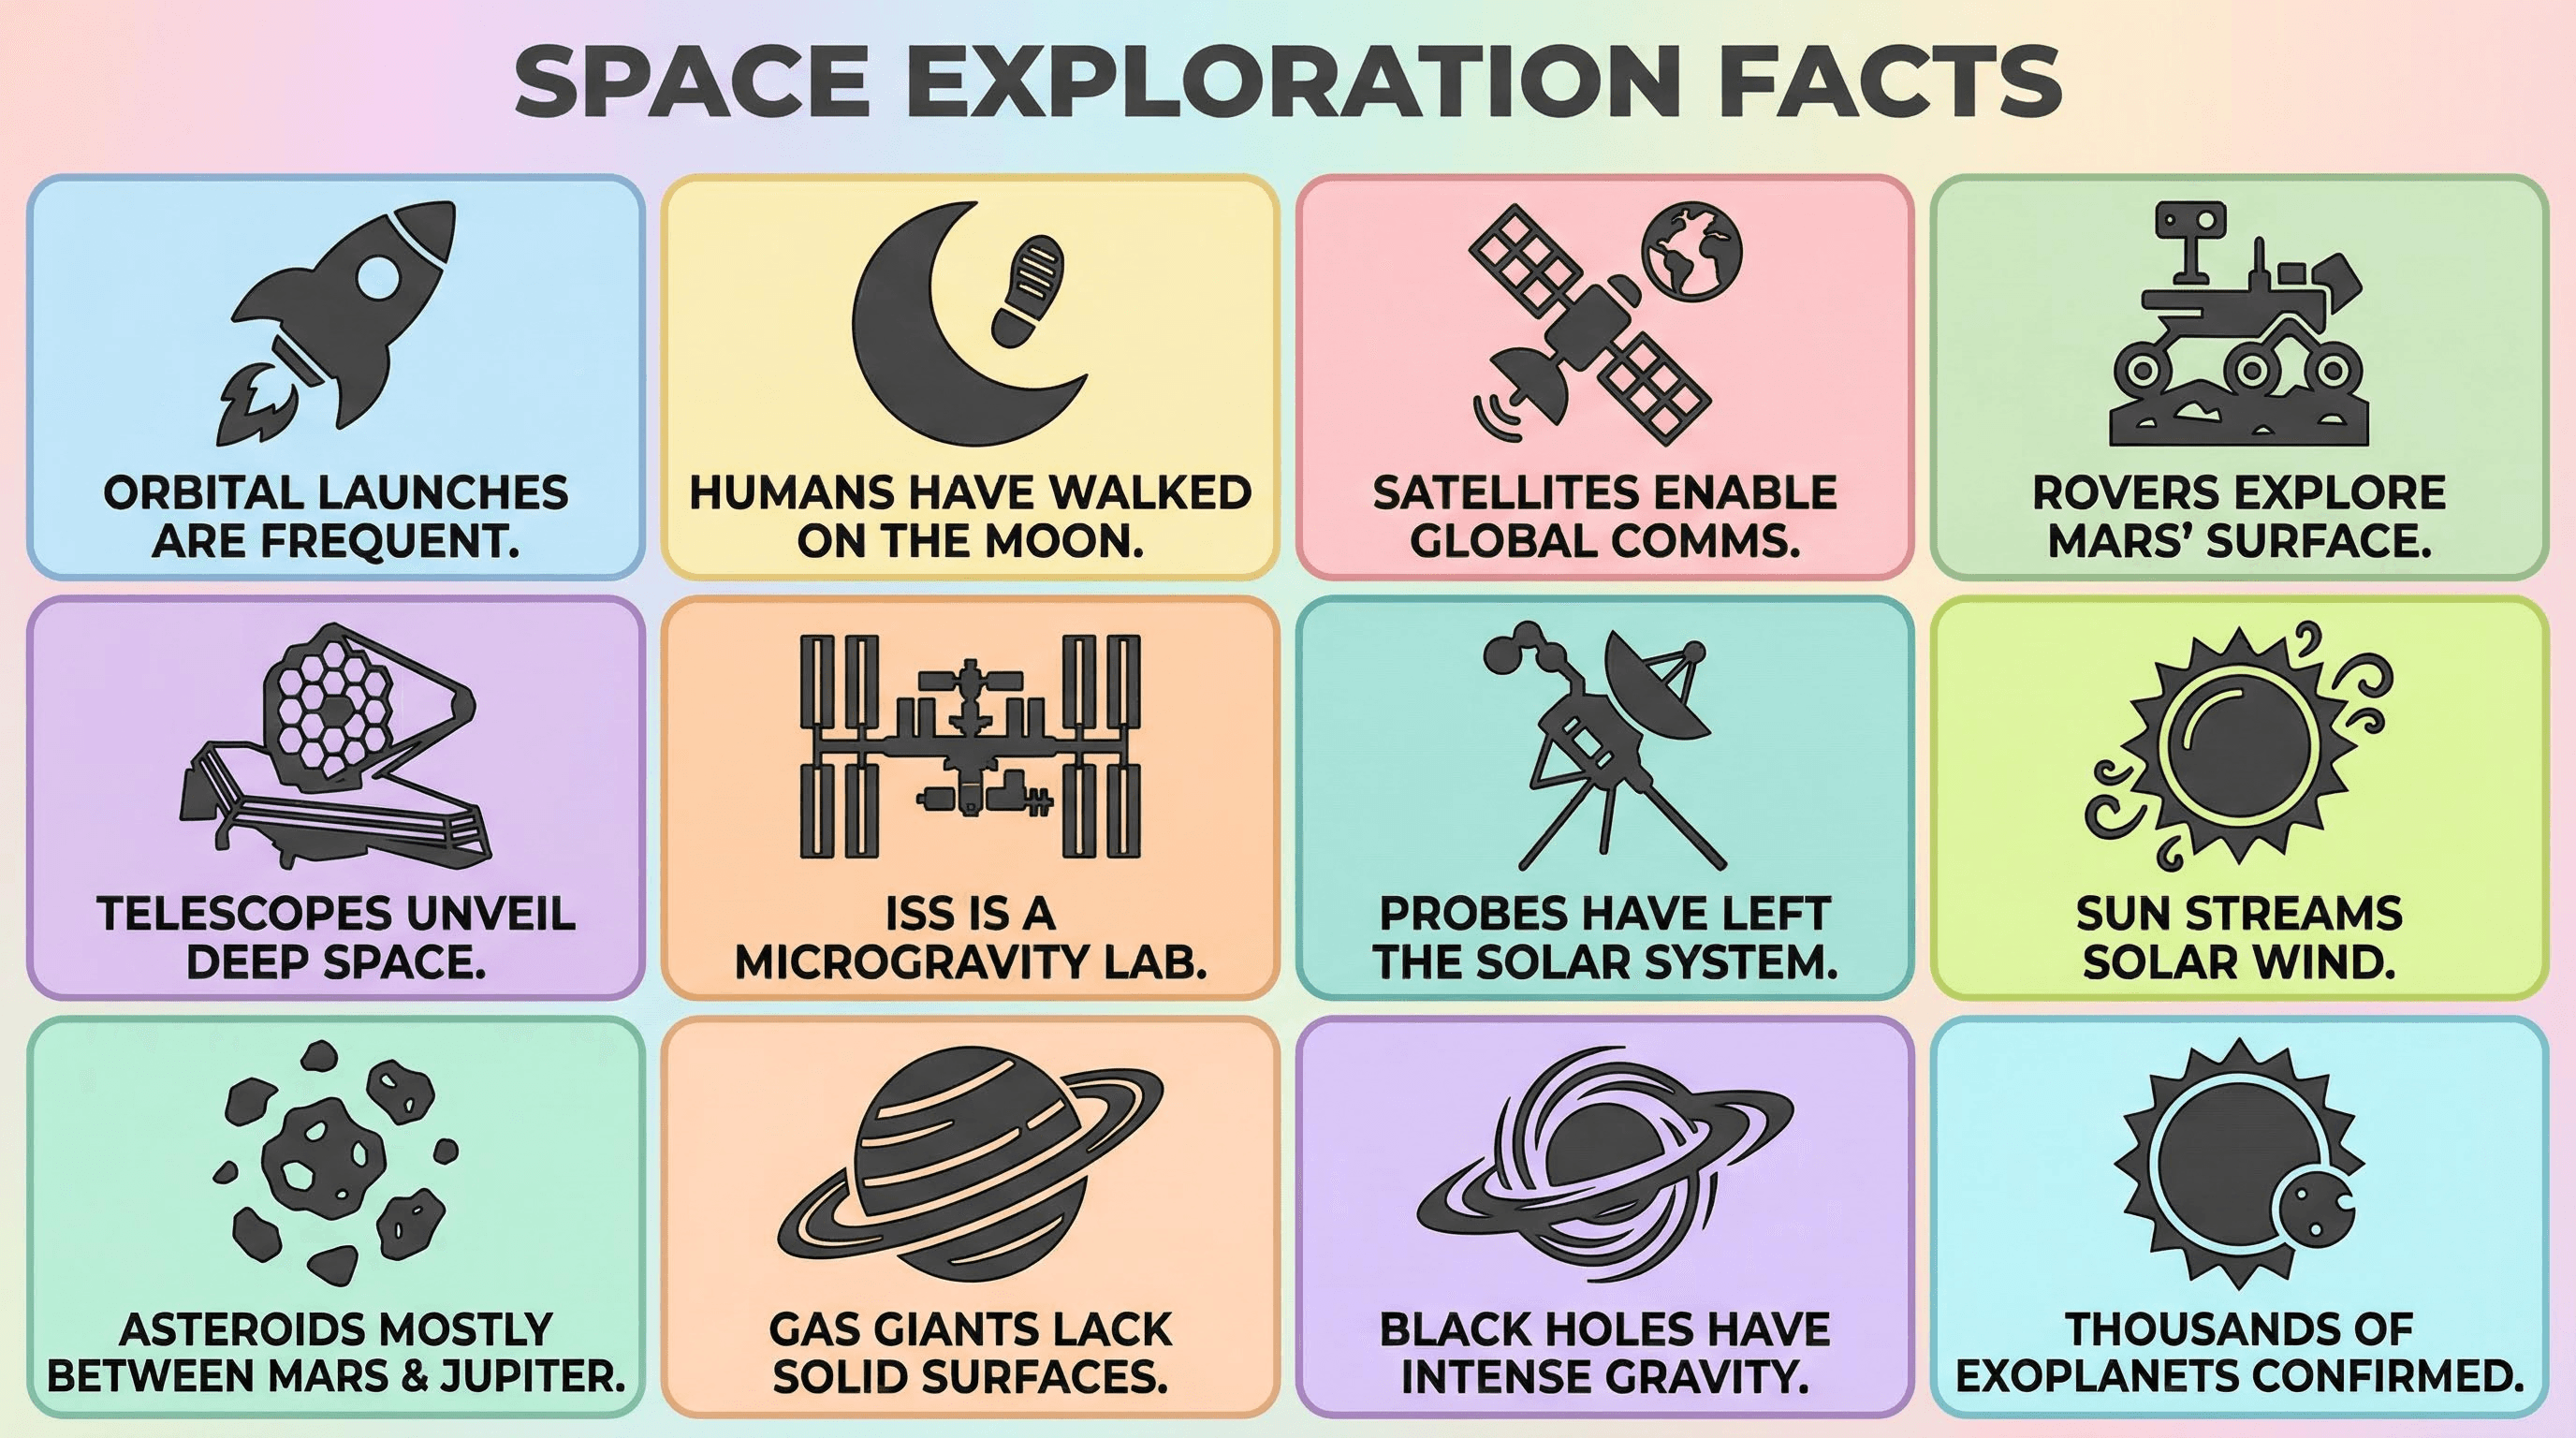
Style: Instagram carousel, quick tips, snackable content.
Create a 3x4 grid infographic for [FACTS TOPIC]. Layout: Tiled bento-box style. Content: Each tile contains one large, flat-design icon and a bold short caption. Palette: Pastel background colors, dark grey icons. Style: Corporate Memphis / Big Tech art style. Highly shareable.
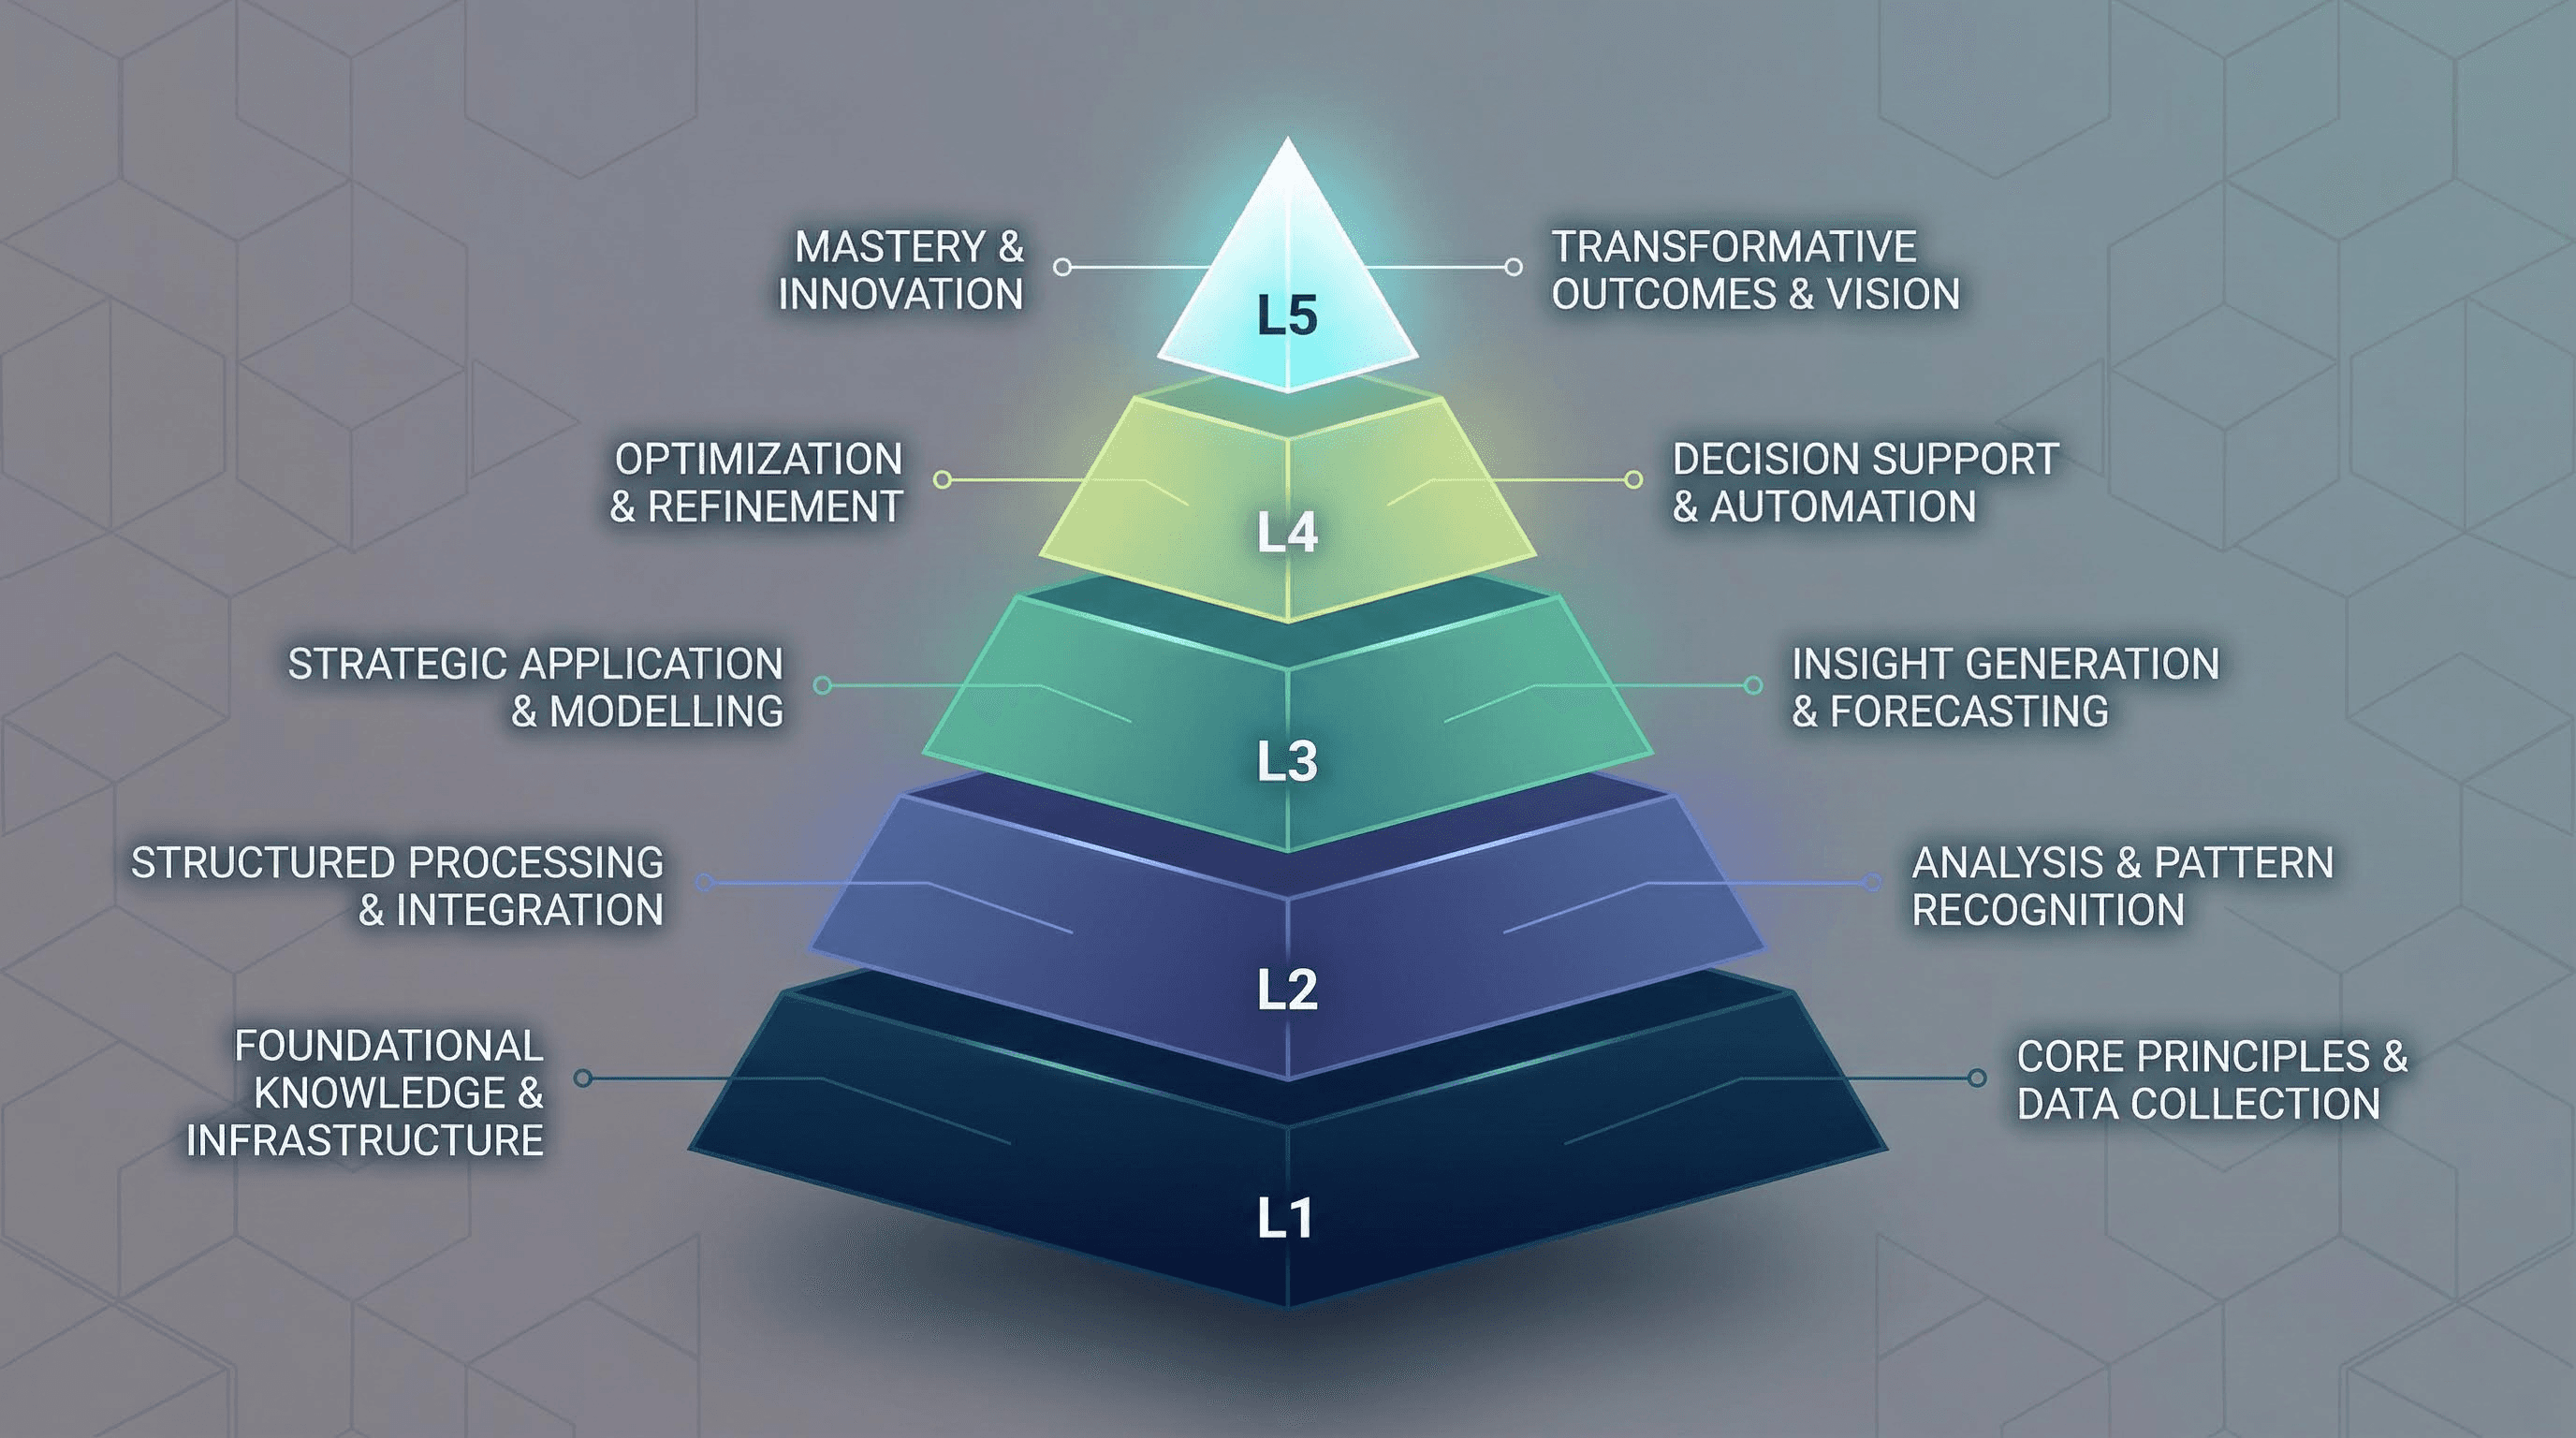
Style: Maslow's hierarchy, levels of mastery.
Design a 5-layer pyramid infographic for [PYRAMID TOPIC]. Visuals: Stylized geometric pyramid. Coloring: Gradient from base (dark) to tip (light). Labels: Floating text on the left and right connected by thin leader lines. Background: Subtle subtle geometric pattern.
Cluster 3: The Educational & Explainer Suite
Best for: How-to guides, course materials, and student resources.
Style: Friendly, approachable, kindergarten-teacher vibes.
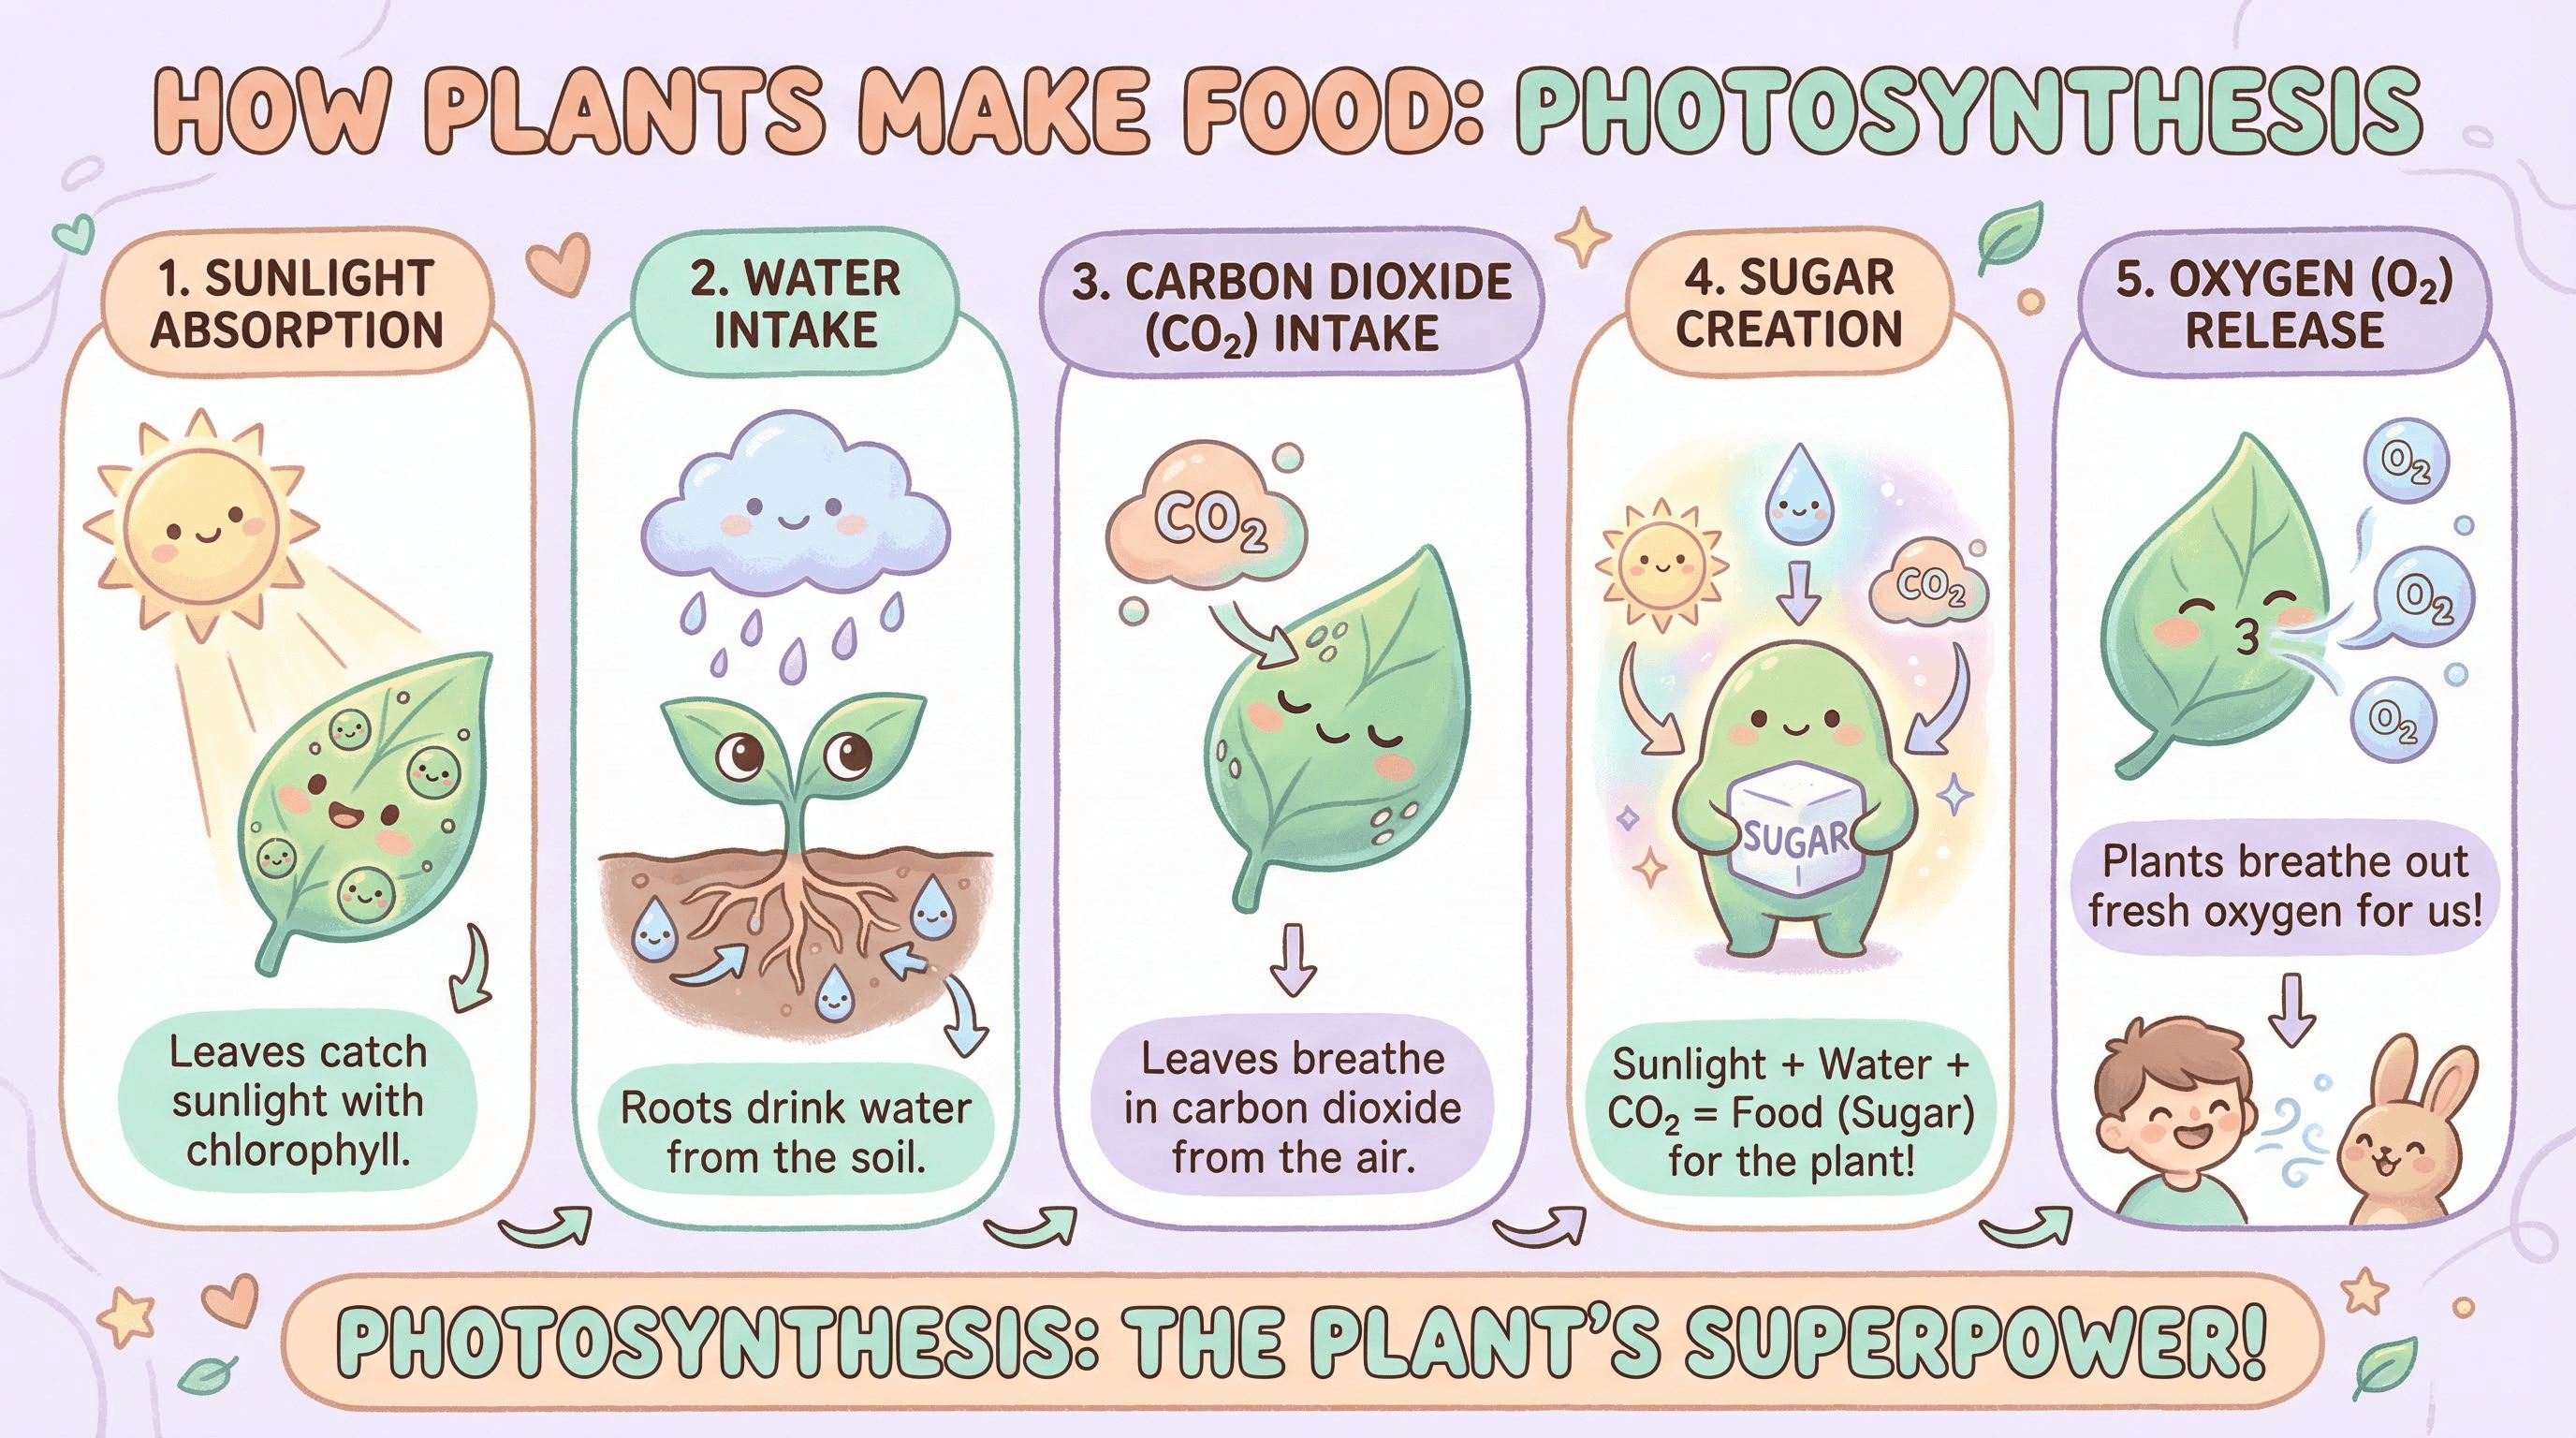
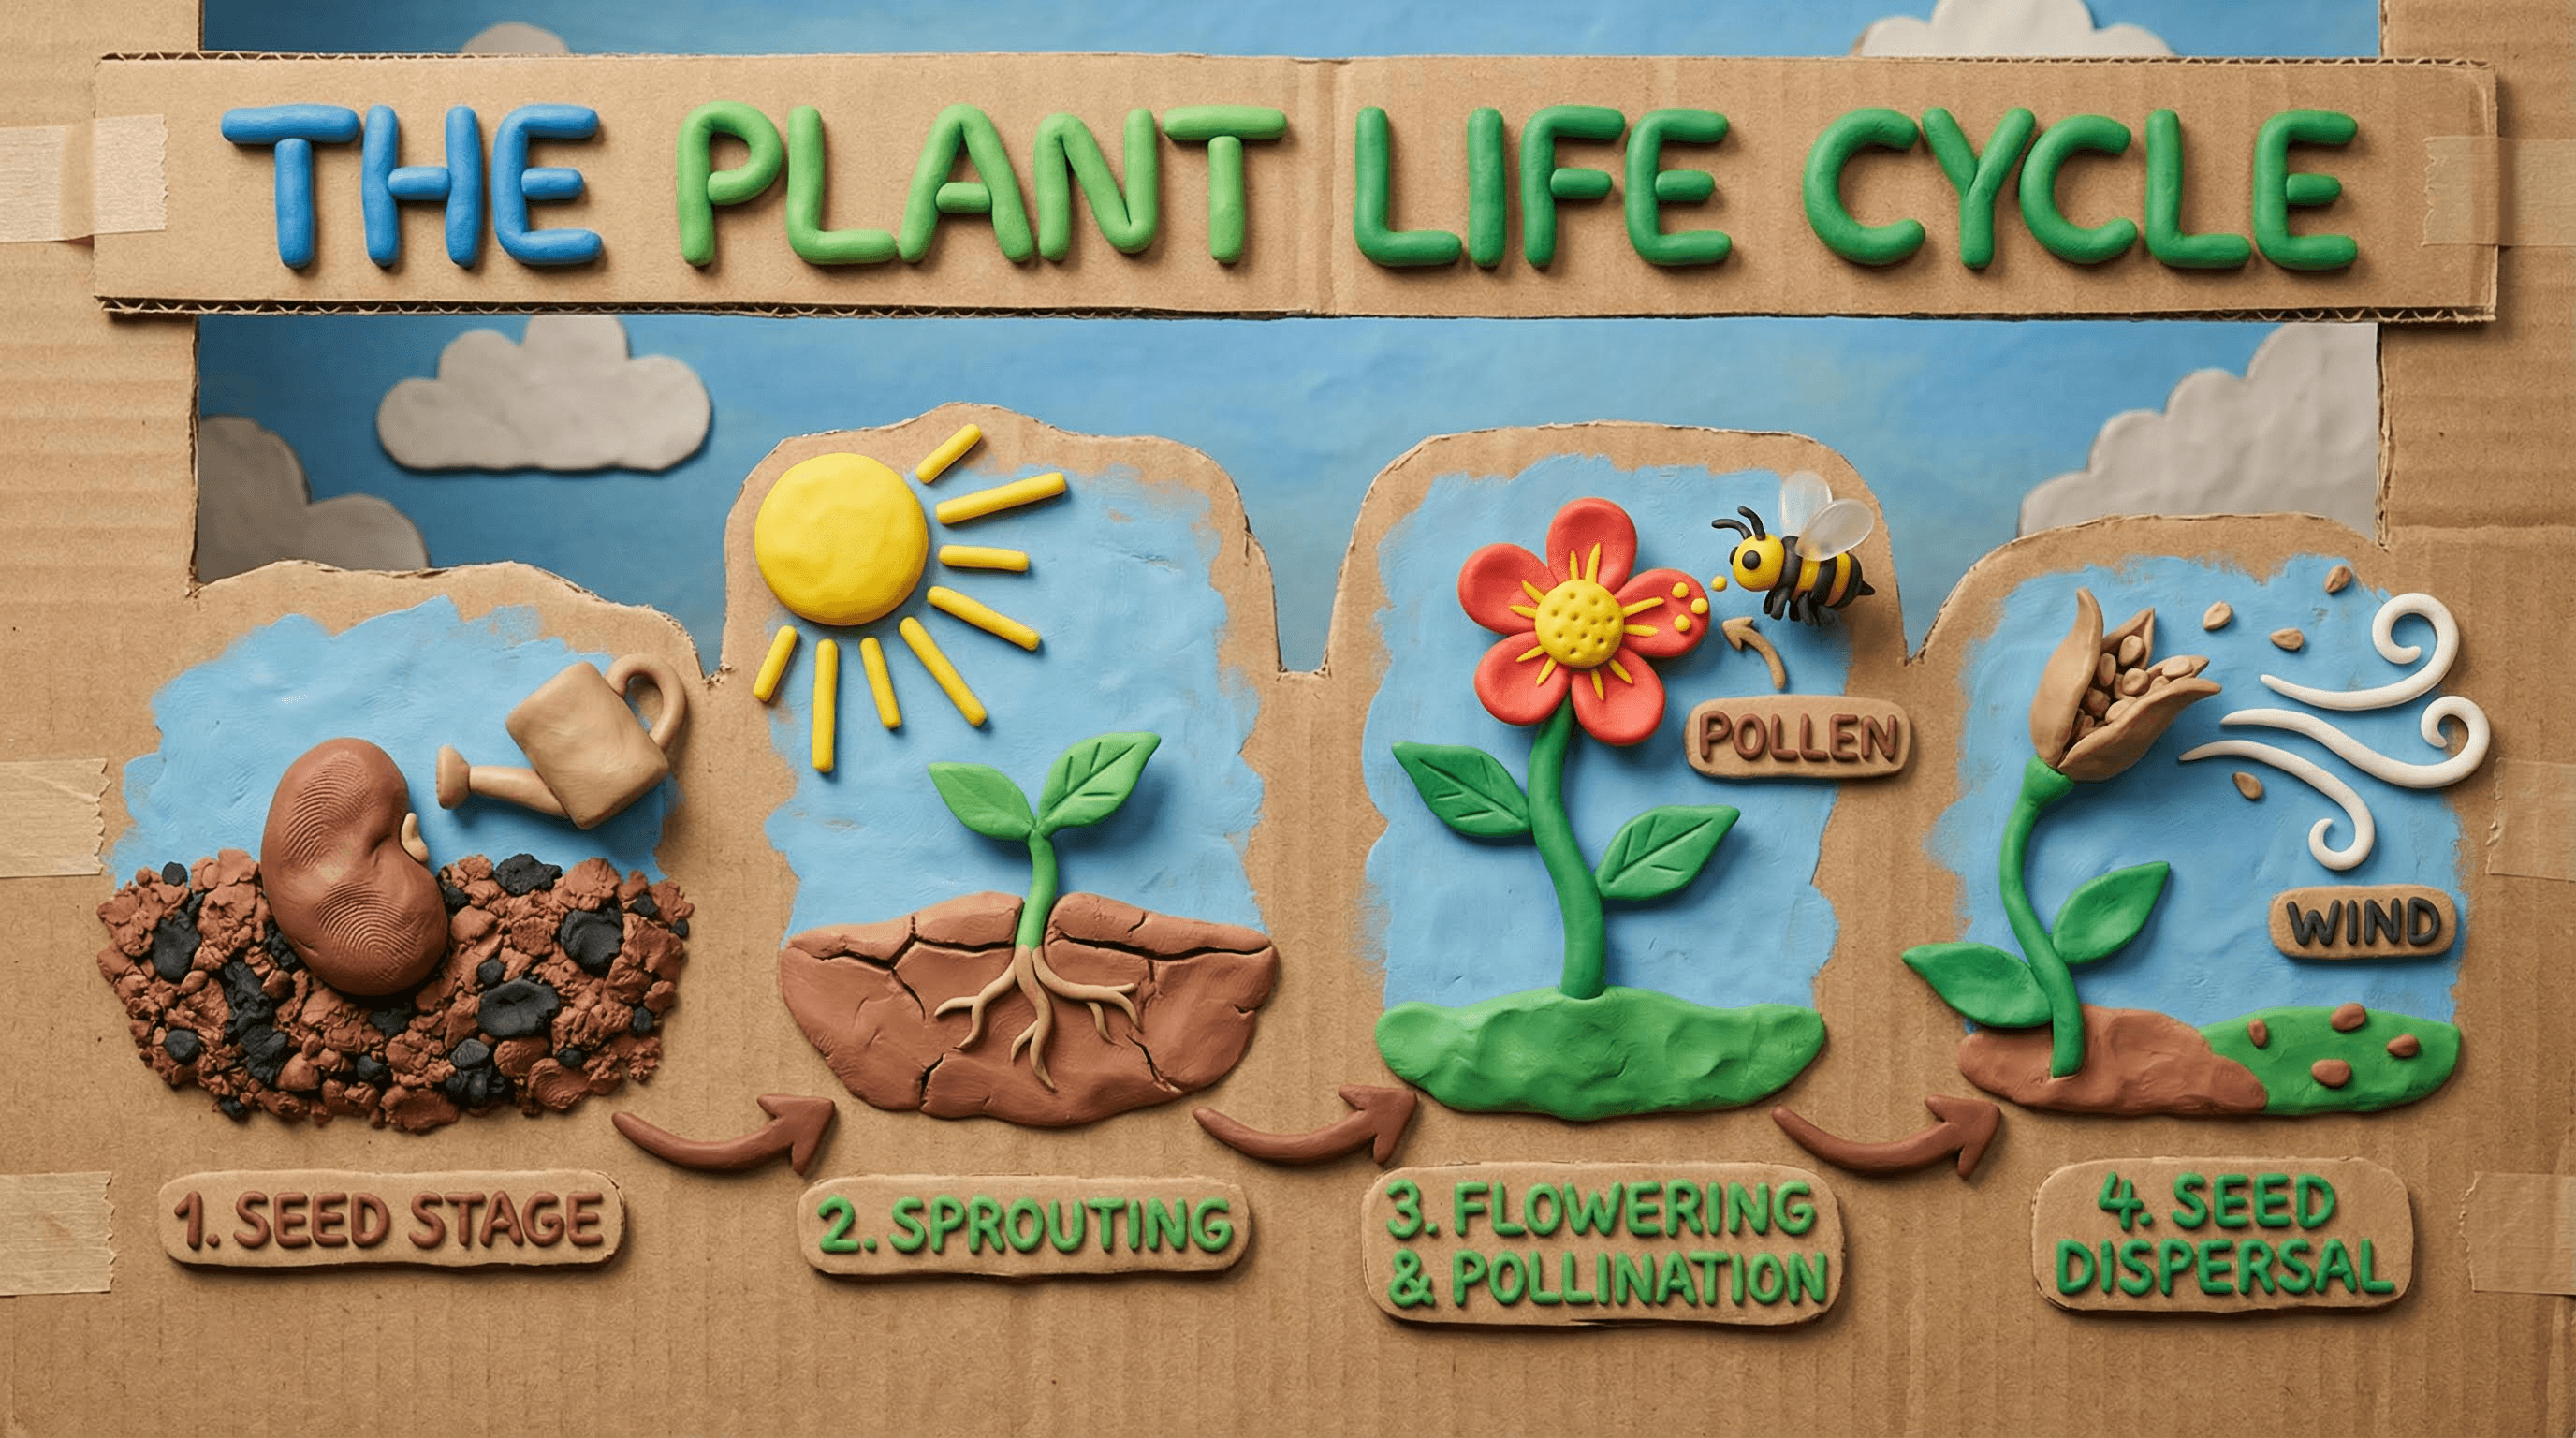
Create a soft, educational infographic explaining [EDUCATIONAL TOPIC]. Style: Hand-drawn vector feel but polished. Palette: Soft pastels (Mint, Peach, Lavender). Visuals: Rounded shapes, friendly characters, bubble letters for headers. Layout: Vertical flow with numbered steps. approachable and kind aesthetic.
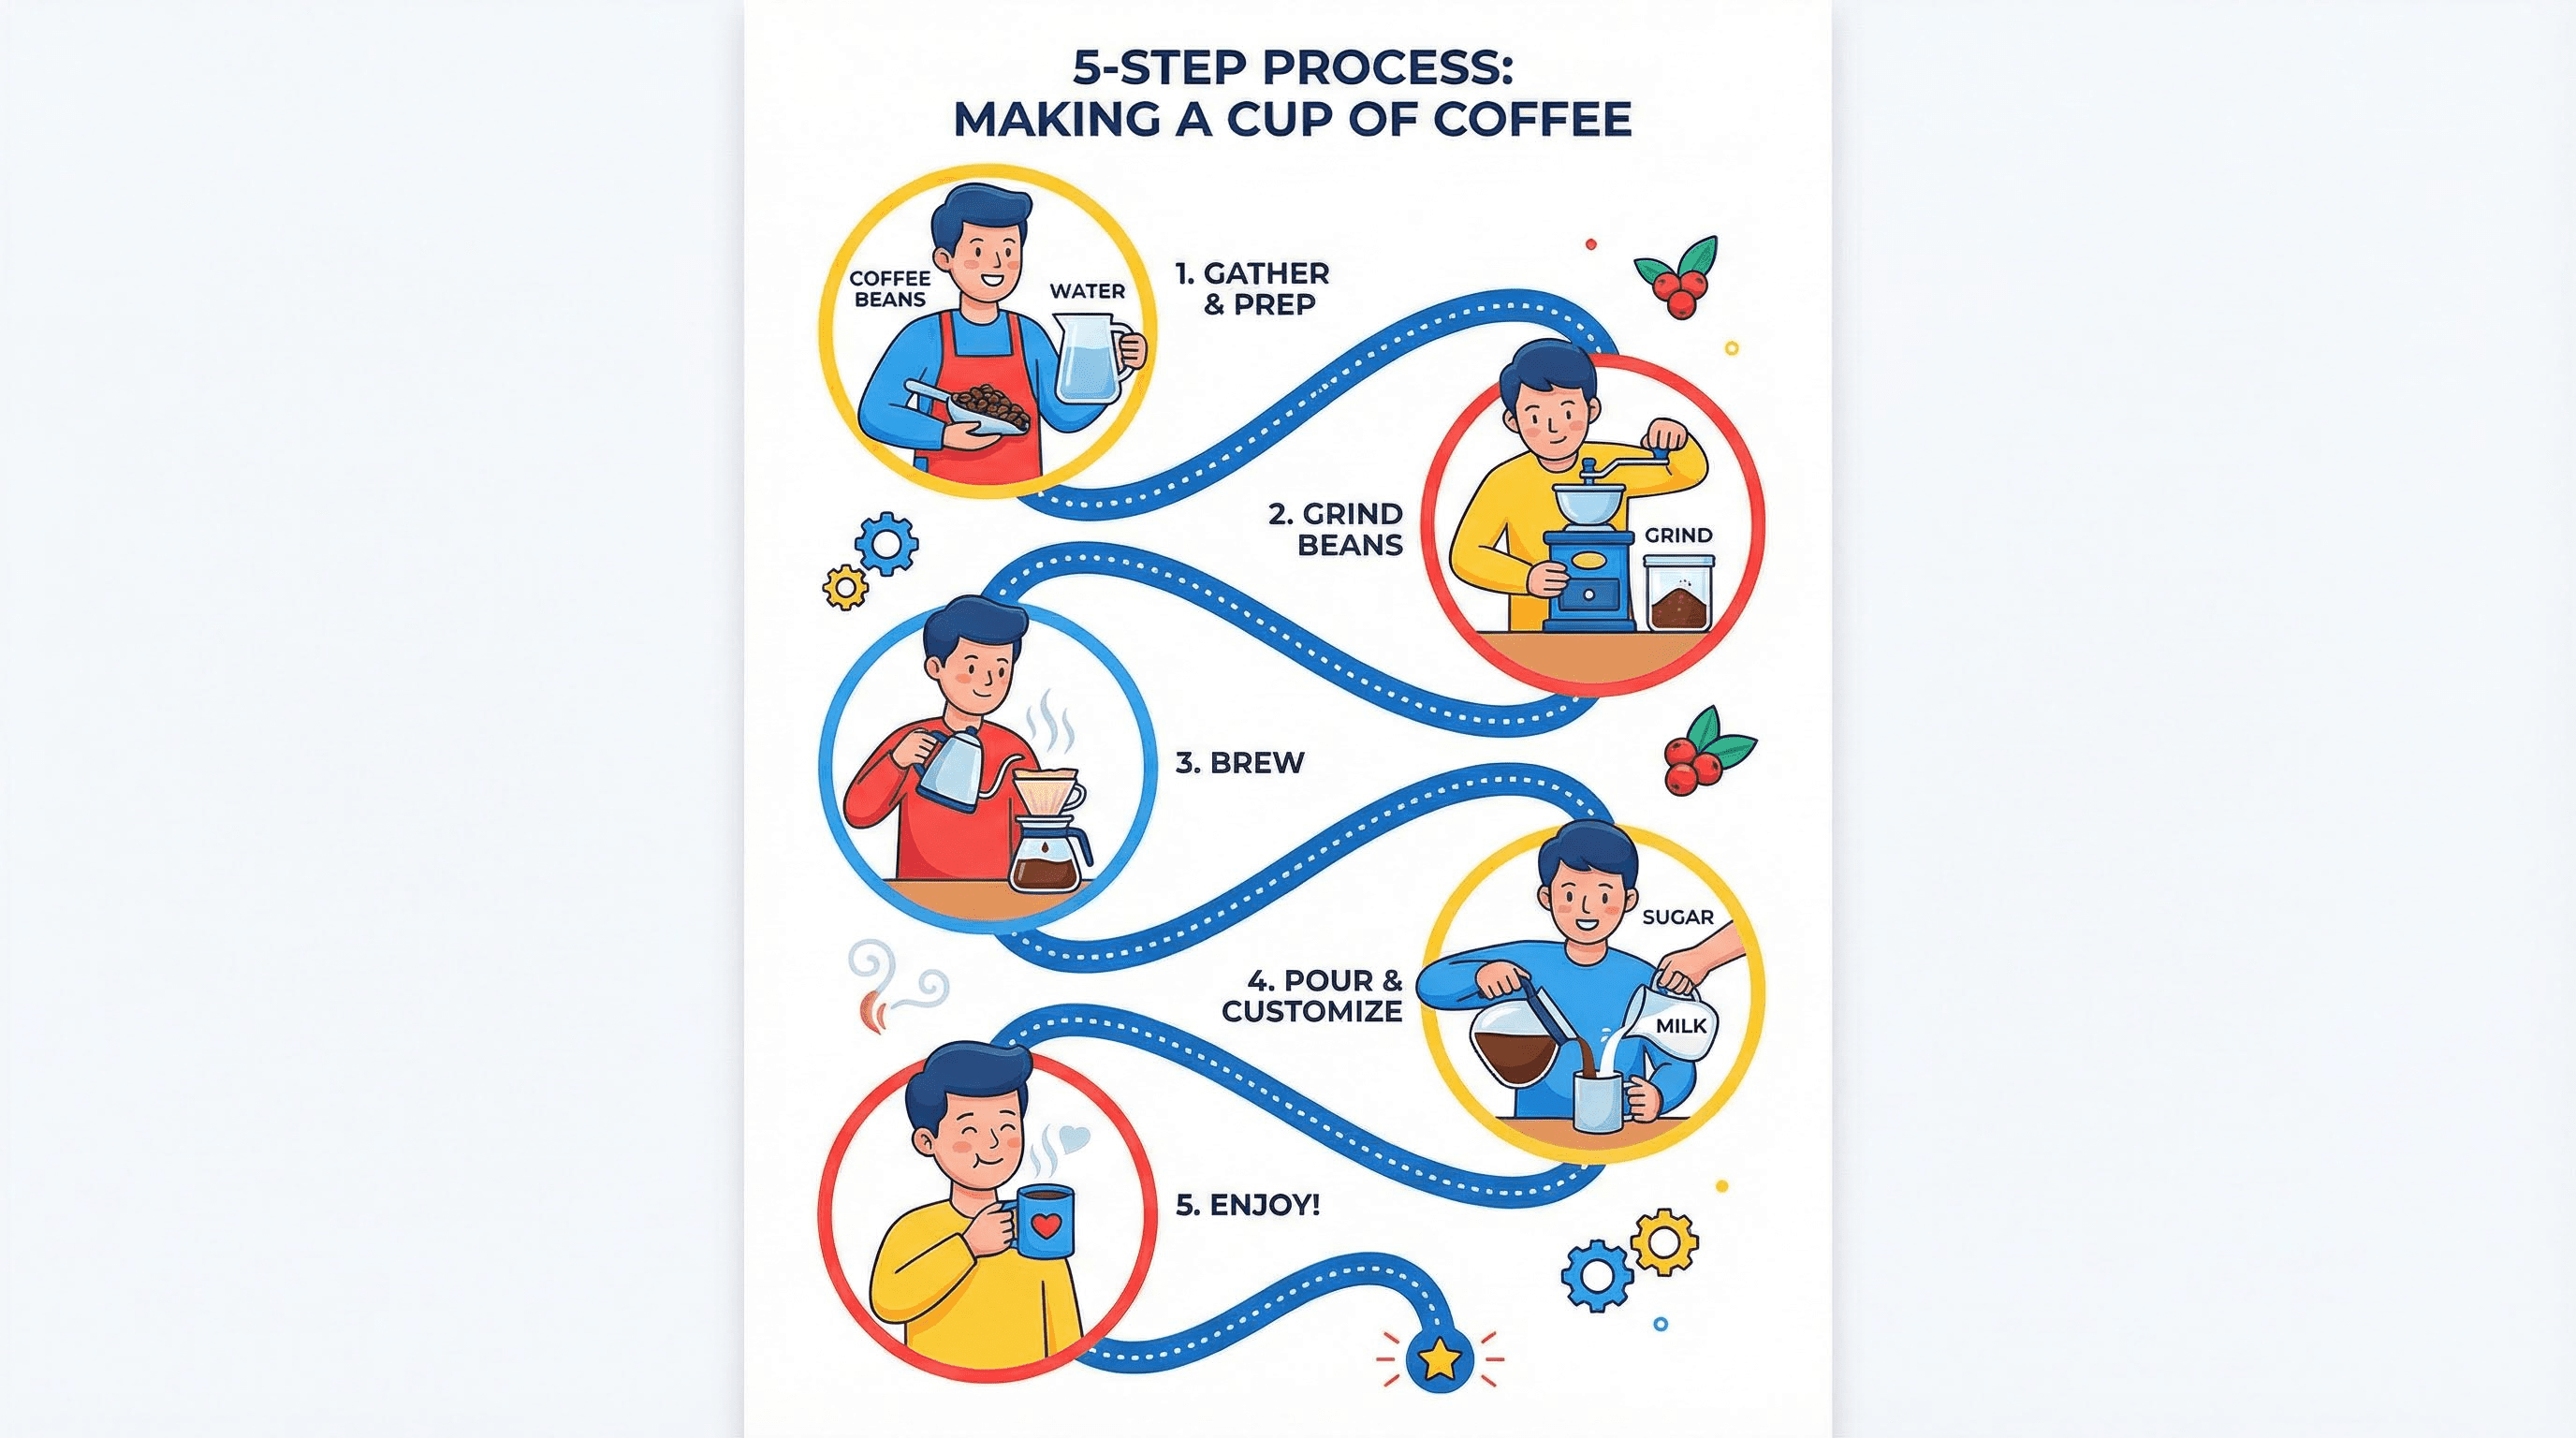
Style: Step-by-step, instruction manual (Ikea style).
Generate a process infographic for [PROCESS TOPIC]. Style: Flat 2.0 vector illustration. Layout: S-Curve path winding down the page. Visuals: 5 distinct steps represented by character illustrations interacting with objects. Connectors: Dotted lines. Colors: Bright primary colors on white.
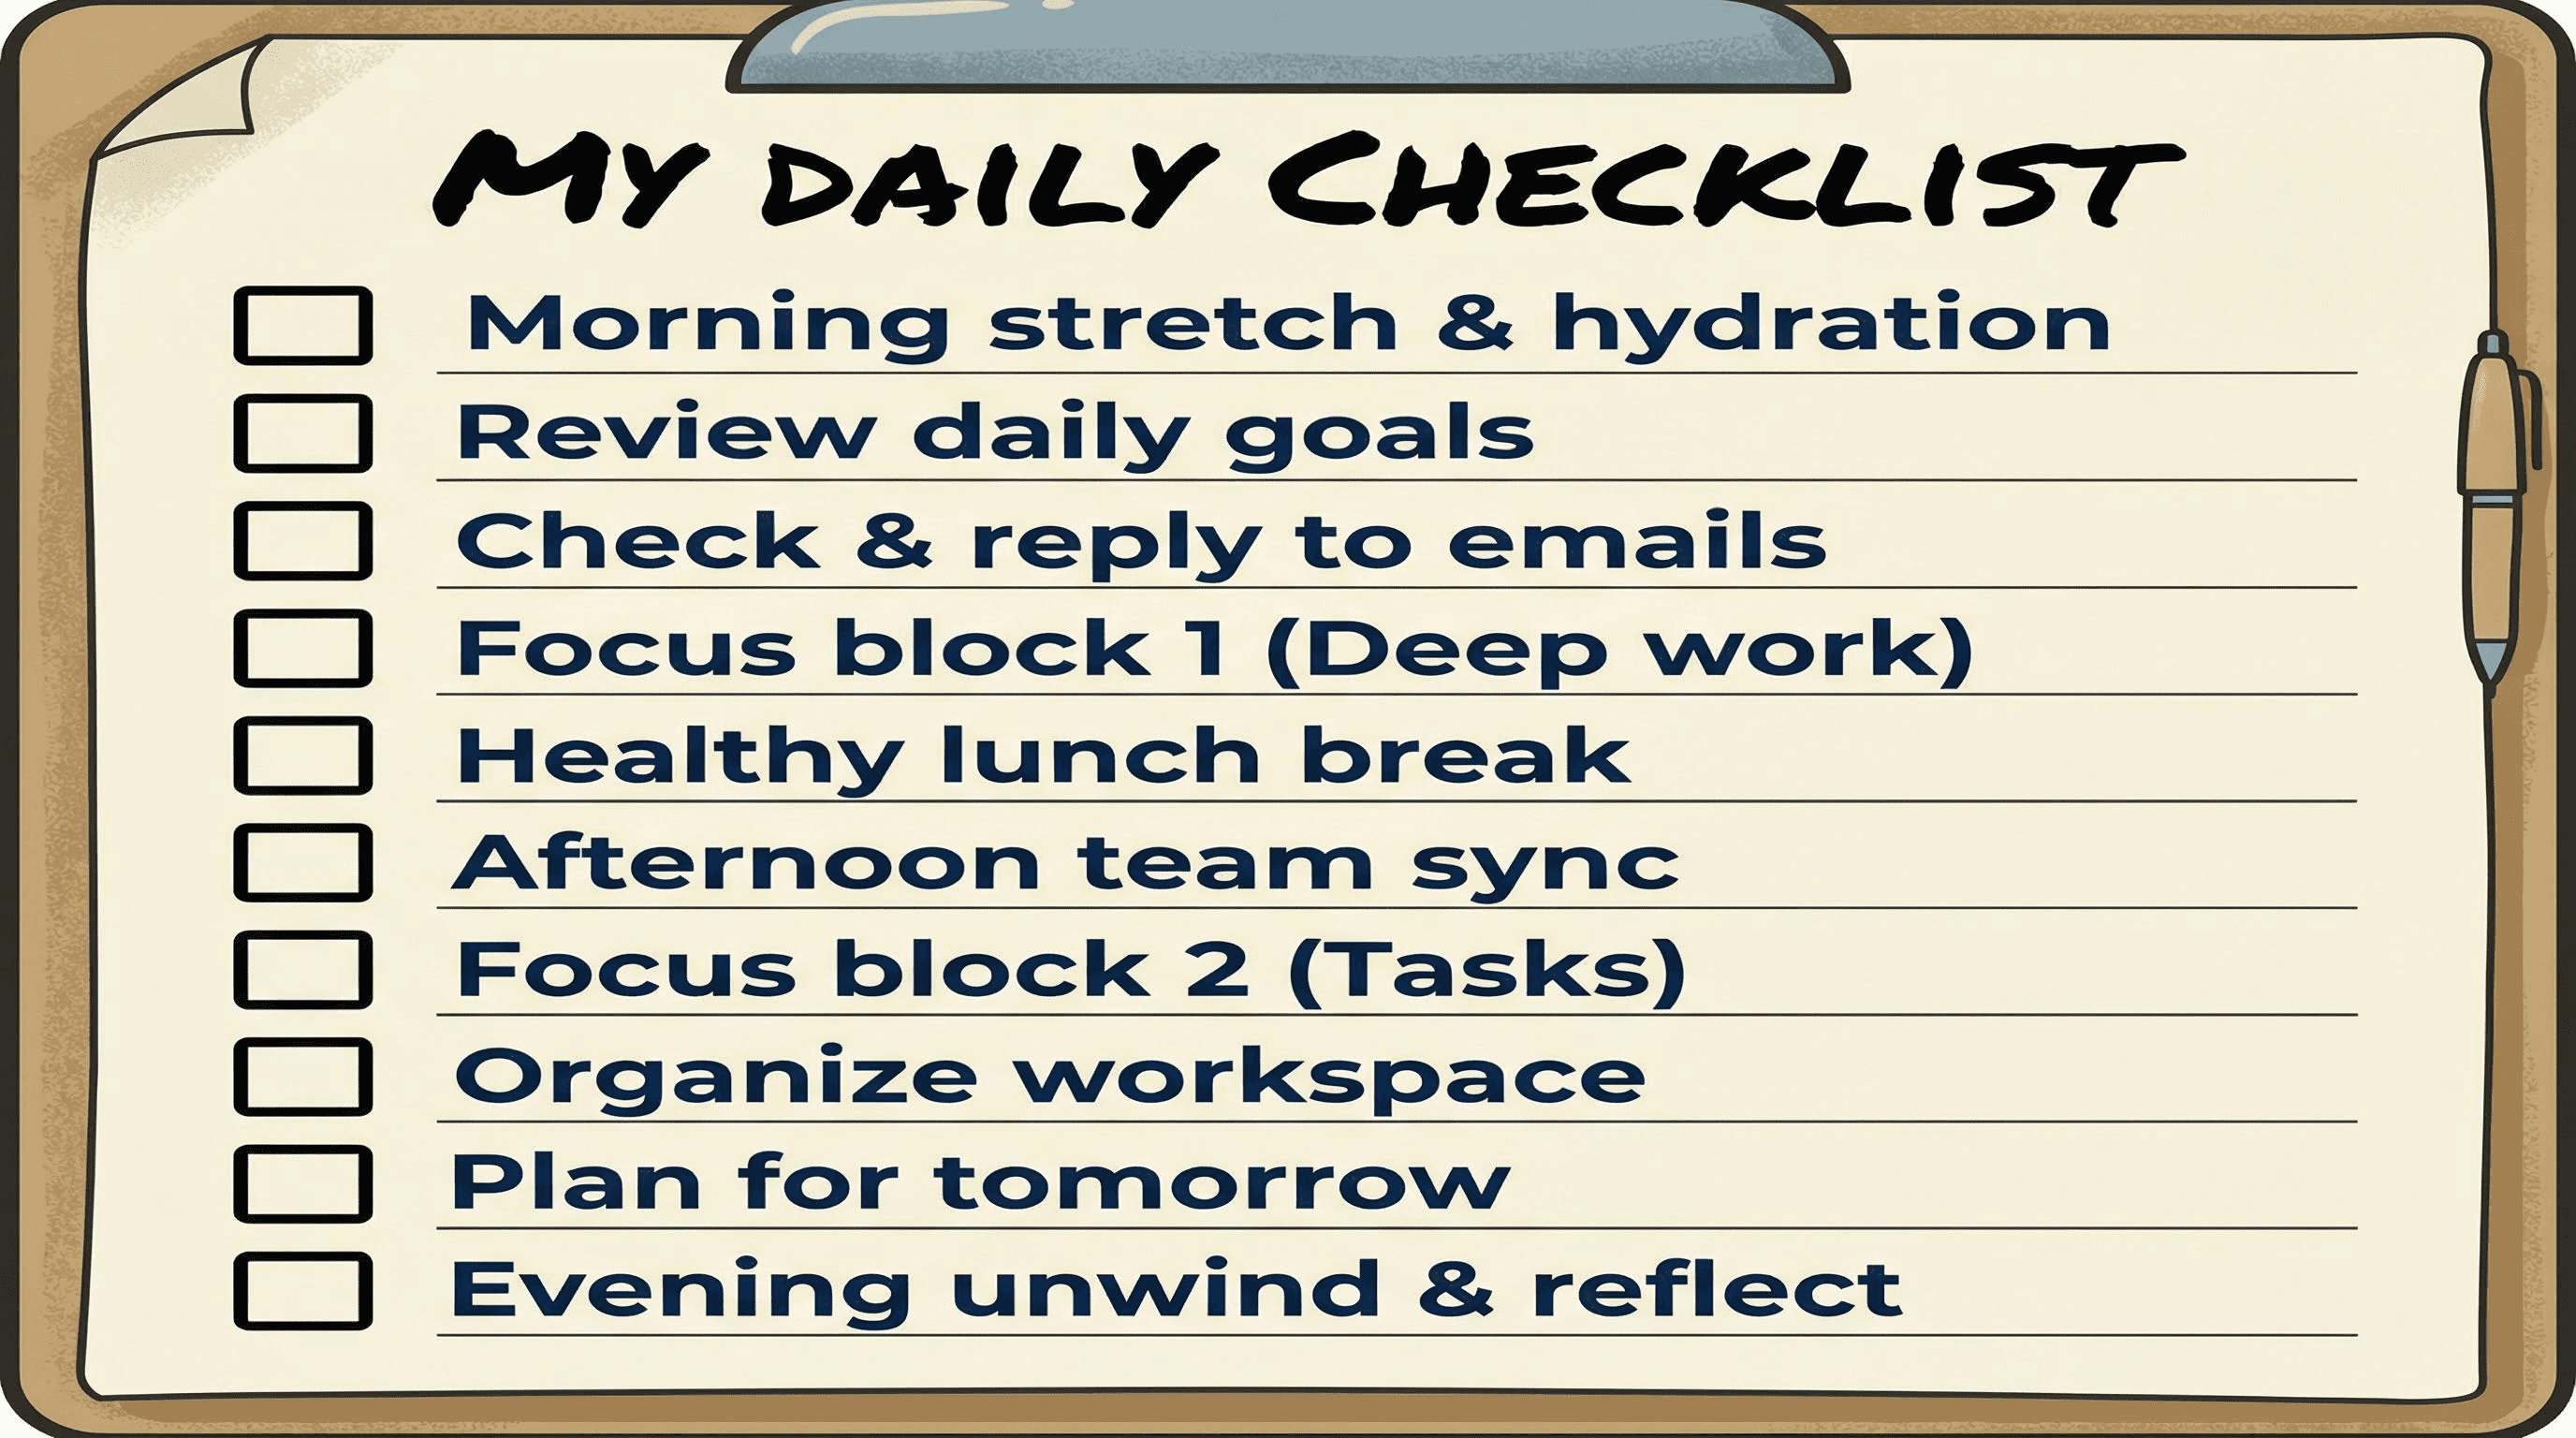
Style: Actionable, clipboard, productivity.
Design a vertical checklist infographic for [CHECKLIST TOPIC]. Visuals: A stylized clipboard or paper background. Content: 10 items with empty checkboxes on the left. Typography: Handwritten marker style for the header, clean sans-serif for the list. clear separation between items.
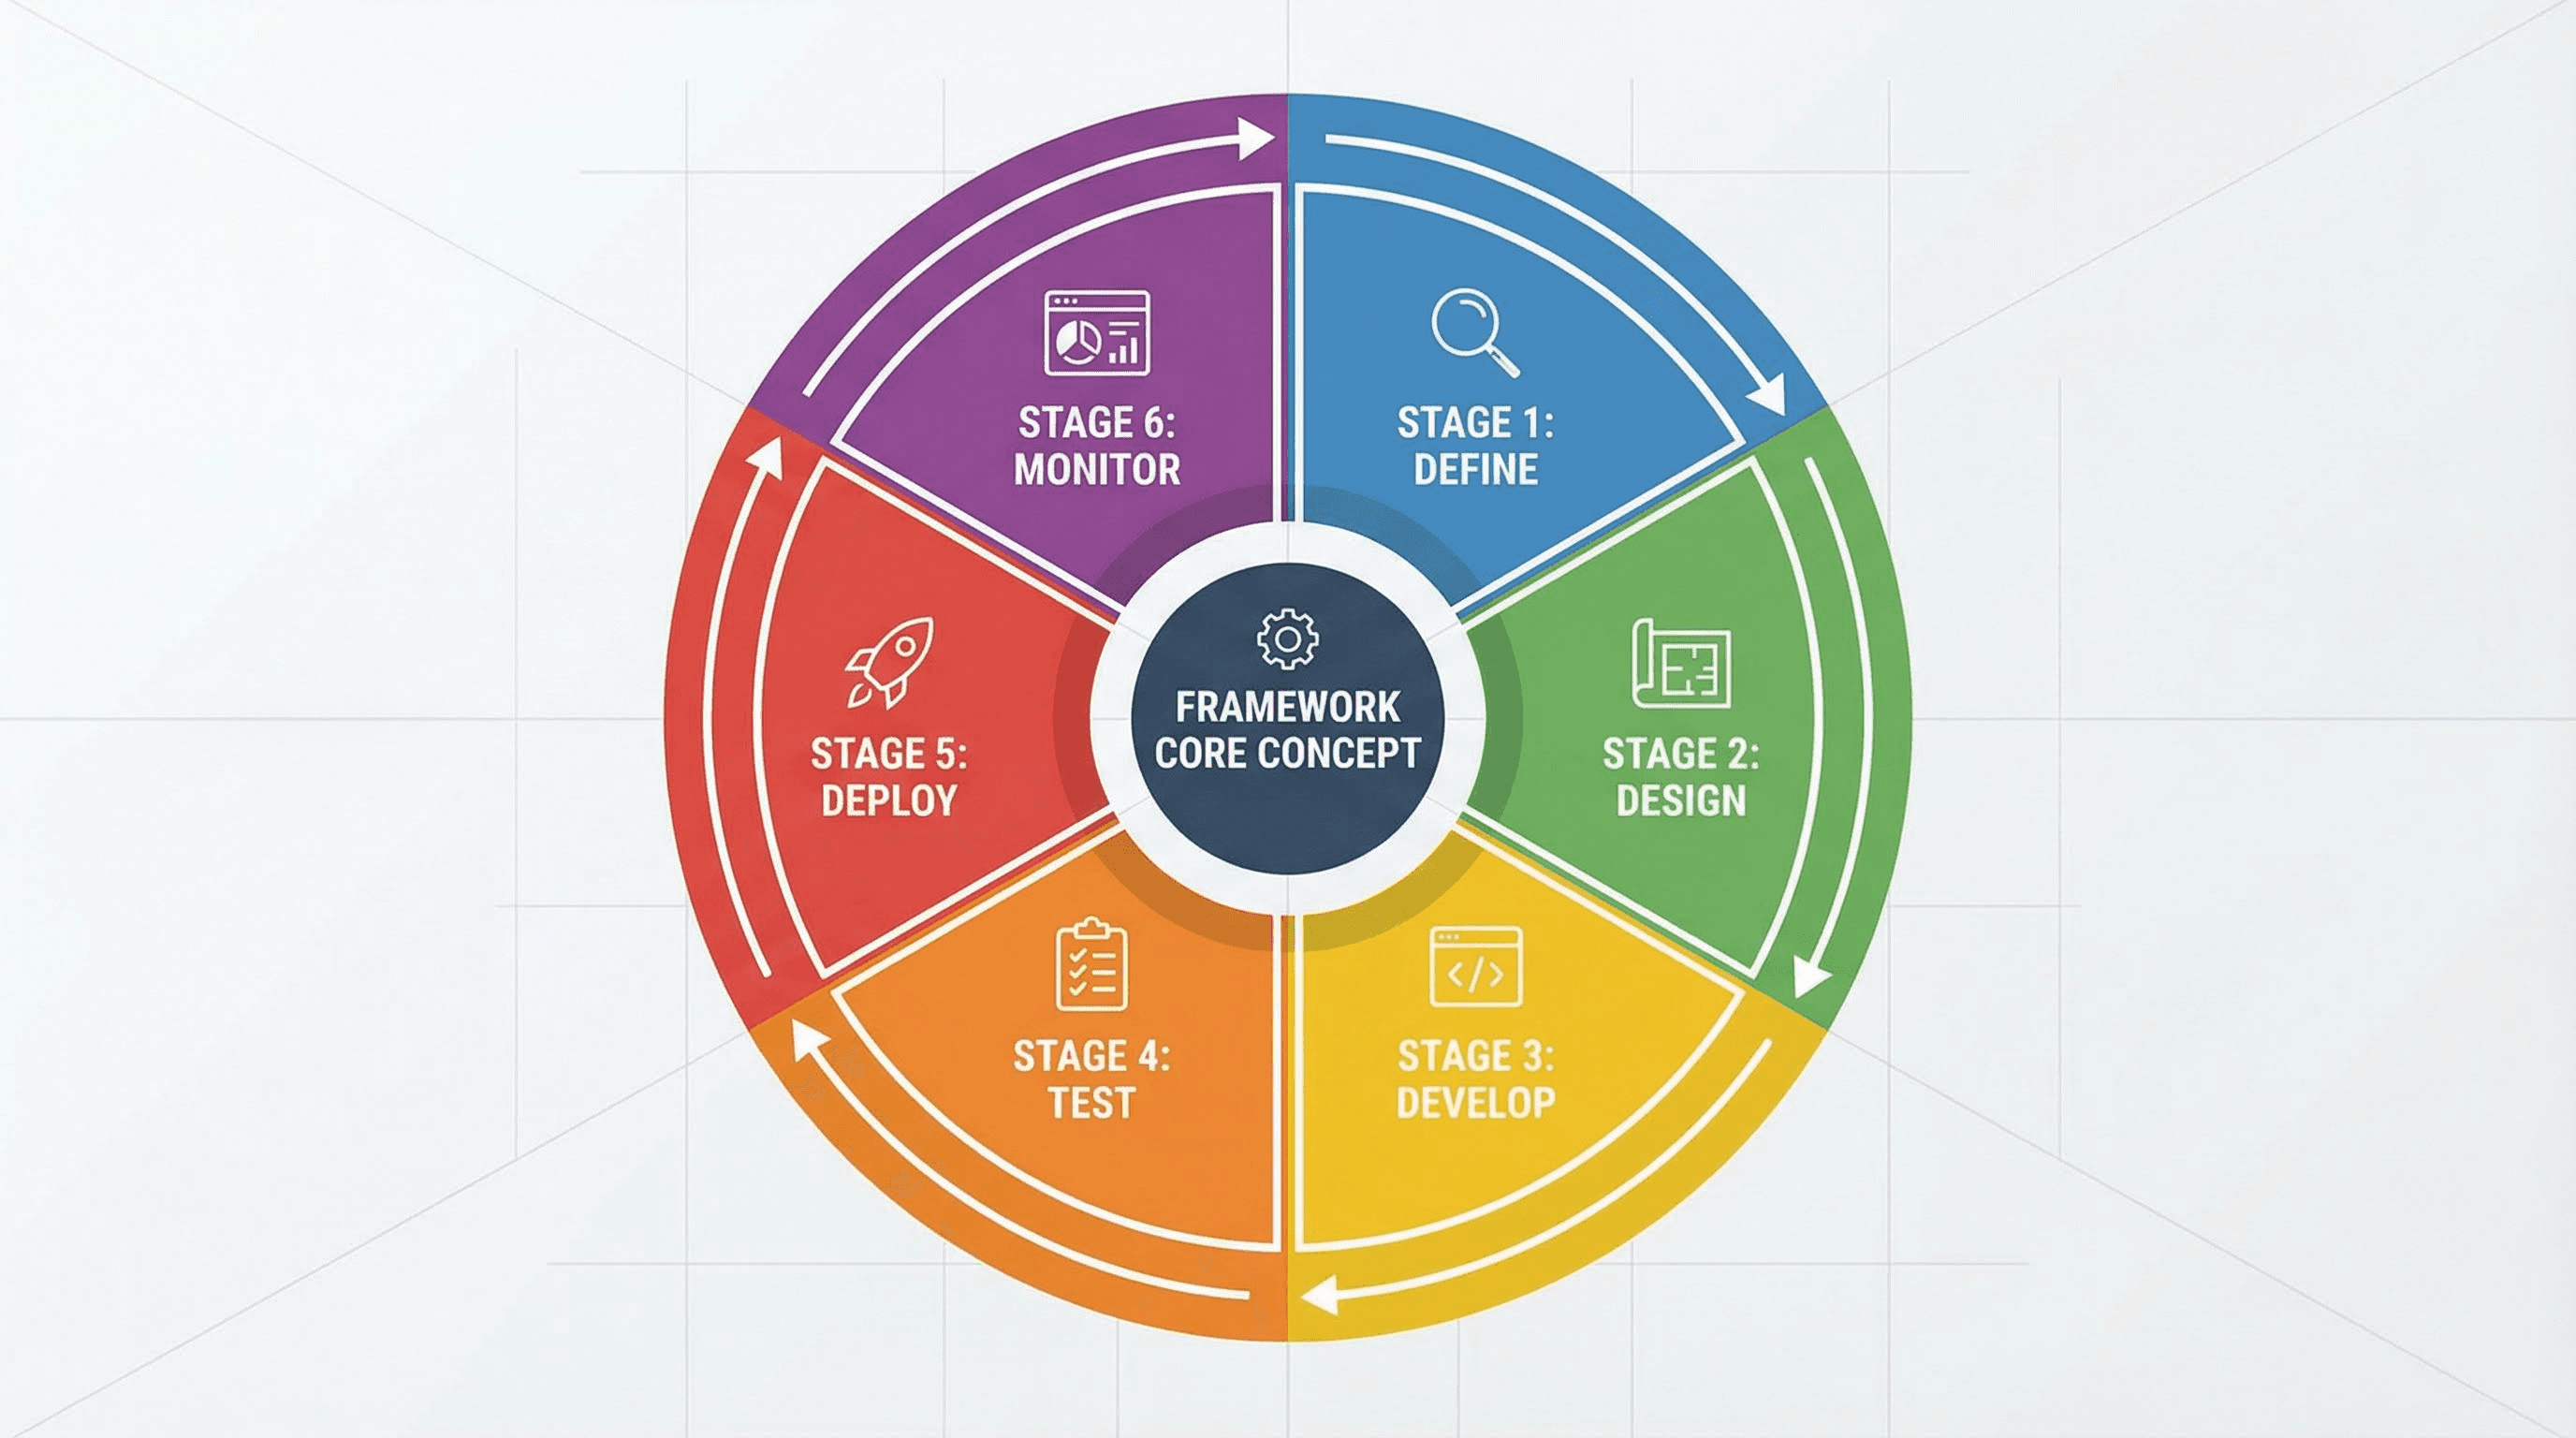
Style: Systems thinking, holistic cycles.
Create a circular cycle infographic for [FRAMEWORK TOPIC]. Layout: Central core concept surrounded by 6 radial segments. Visuals: Donut chart aesthetic, flat colors. Arrows indicating clockwise movement. Icons inside each segment. Clean, mathematical precision.
Style: Pinterest tall-pin, deep dive.
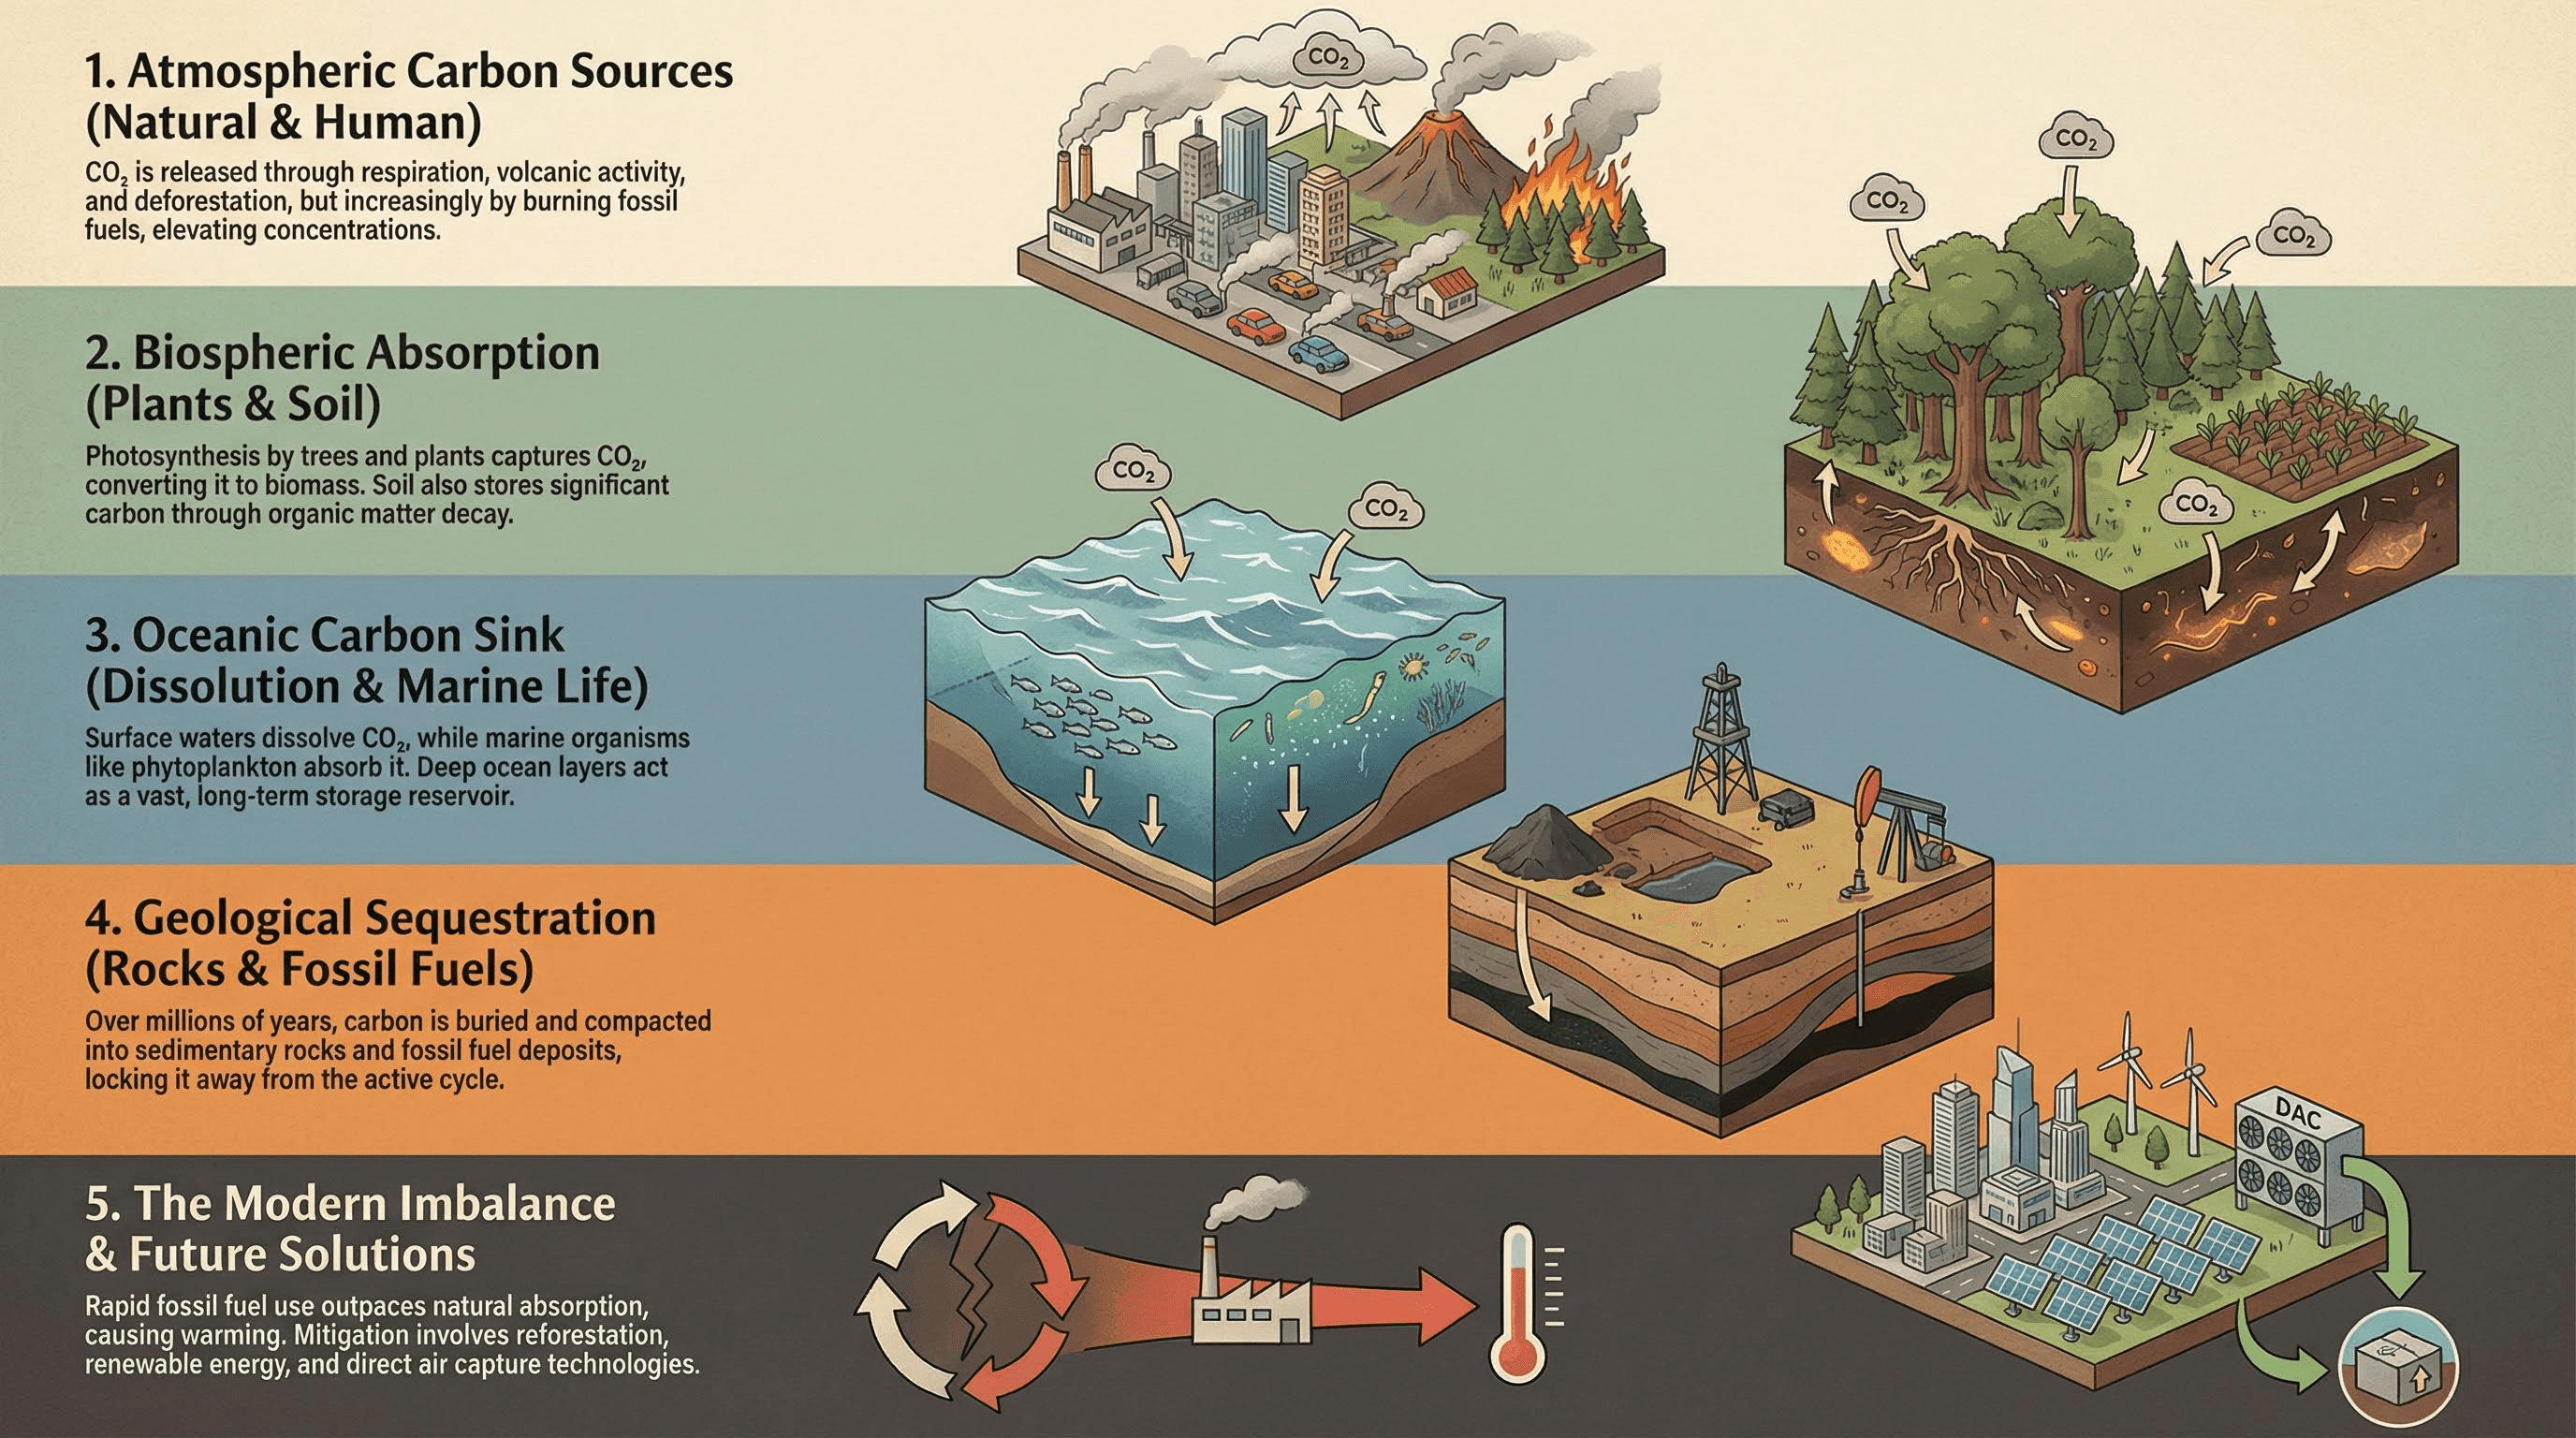
Generate a tall, long-form infographic panel for [EXPLAINER TOPIC]. Structure: Divided into 5 horizontal colored bands. Content: Each band features a headline, a small paragraph, and a supporting isometric illustration. Style: Editorial illustration, muted earth tones.
Cluster 4: The Creative & Conceptual Suite
Best for: Brainstorming, creative blocks, and artistic visualization.
Style: Notebook, napkin math, brainstorming.
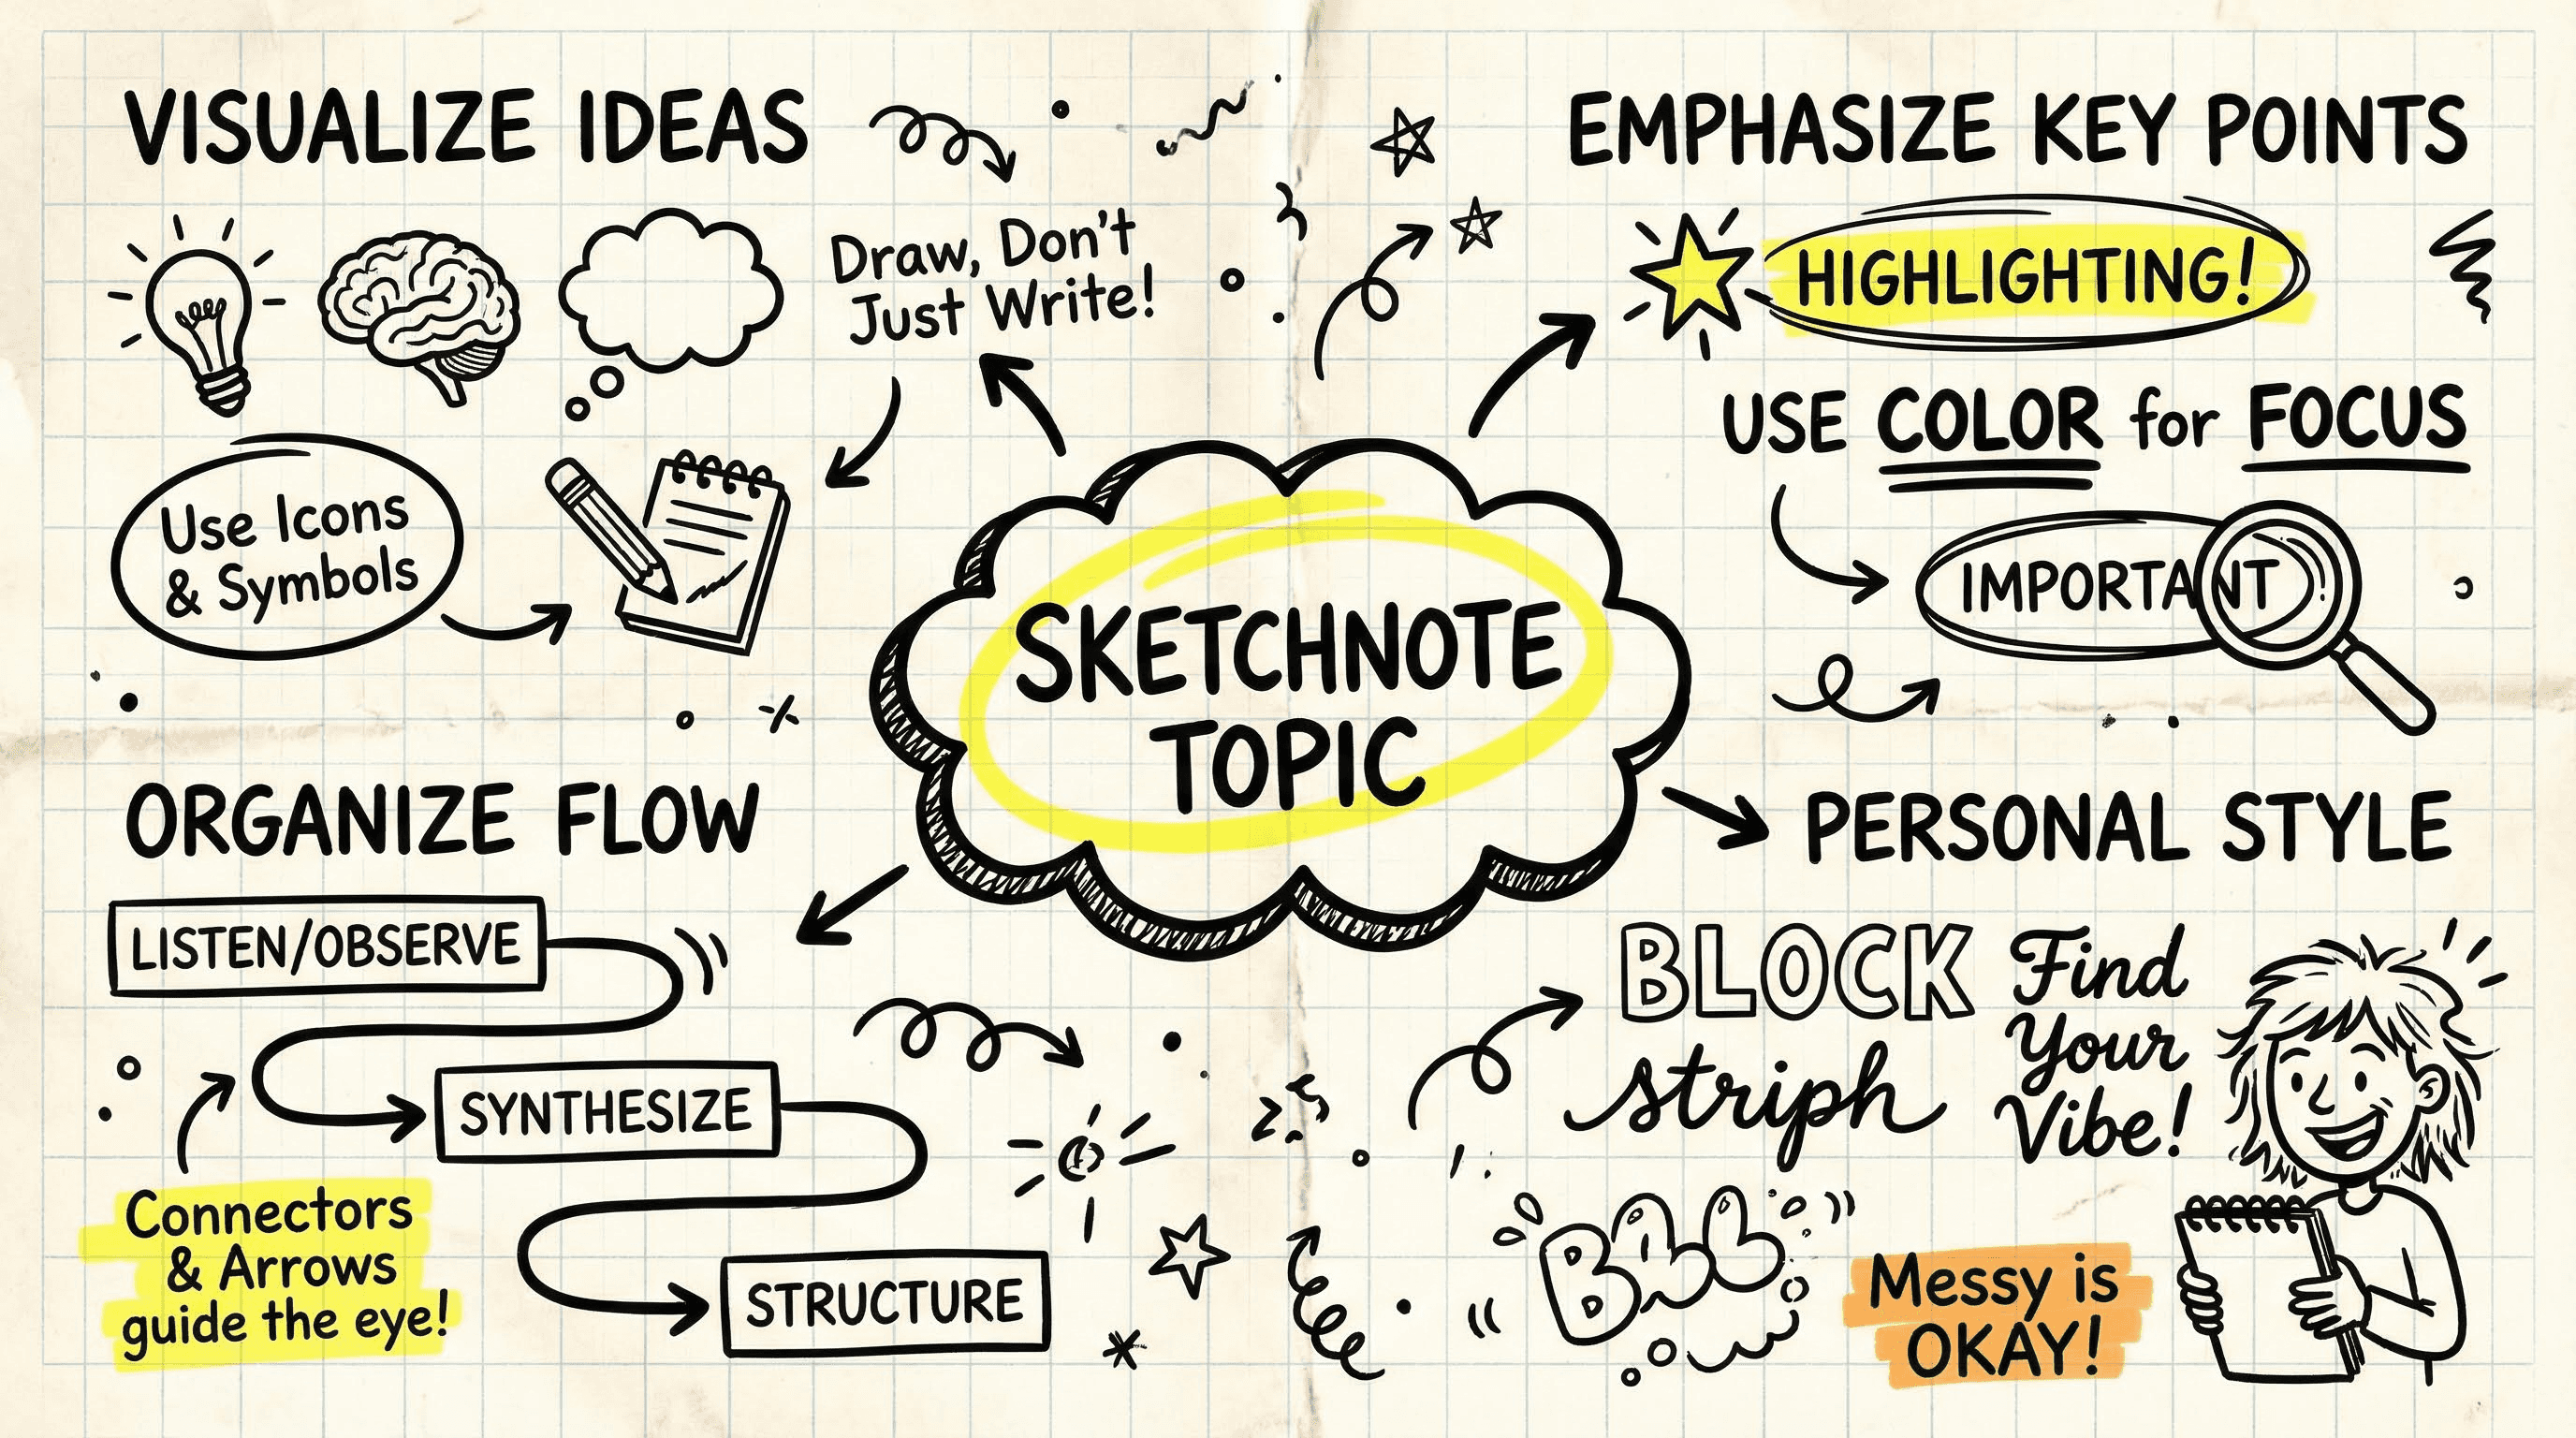
Design a sketchnote style infographic for [SKETCHNOTE TOPIC]. Background: Crumpled graph paper texture. Visuals: Doodle-style thick marker lines, hand-drawn arrows, circled text, highlighted emphasis. Font: Realistic handwriting style. Casual and creative vibe.
Style: Neural network, brainstorming web.
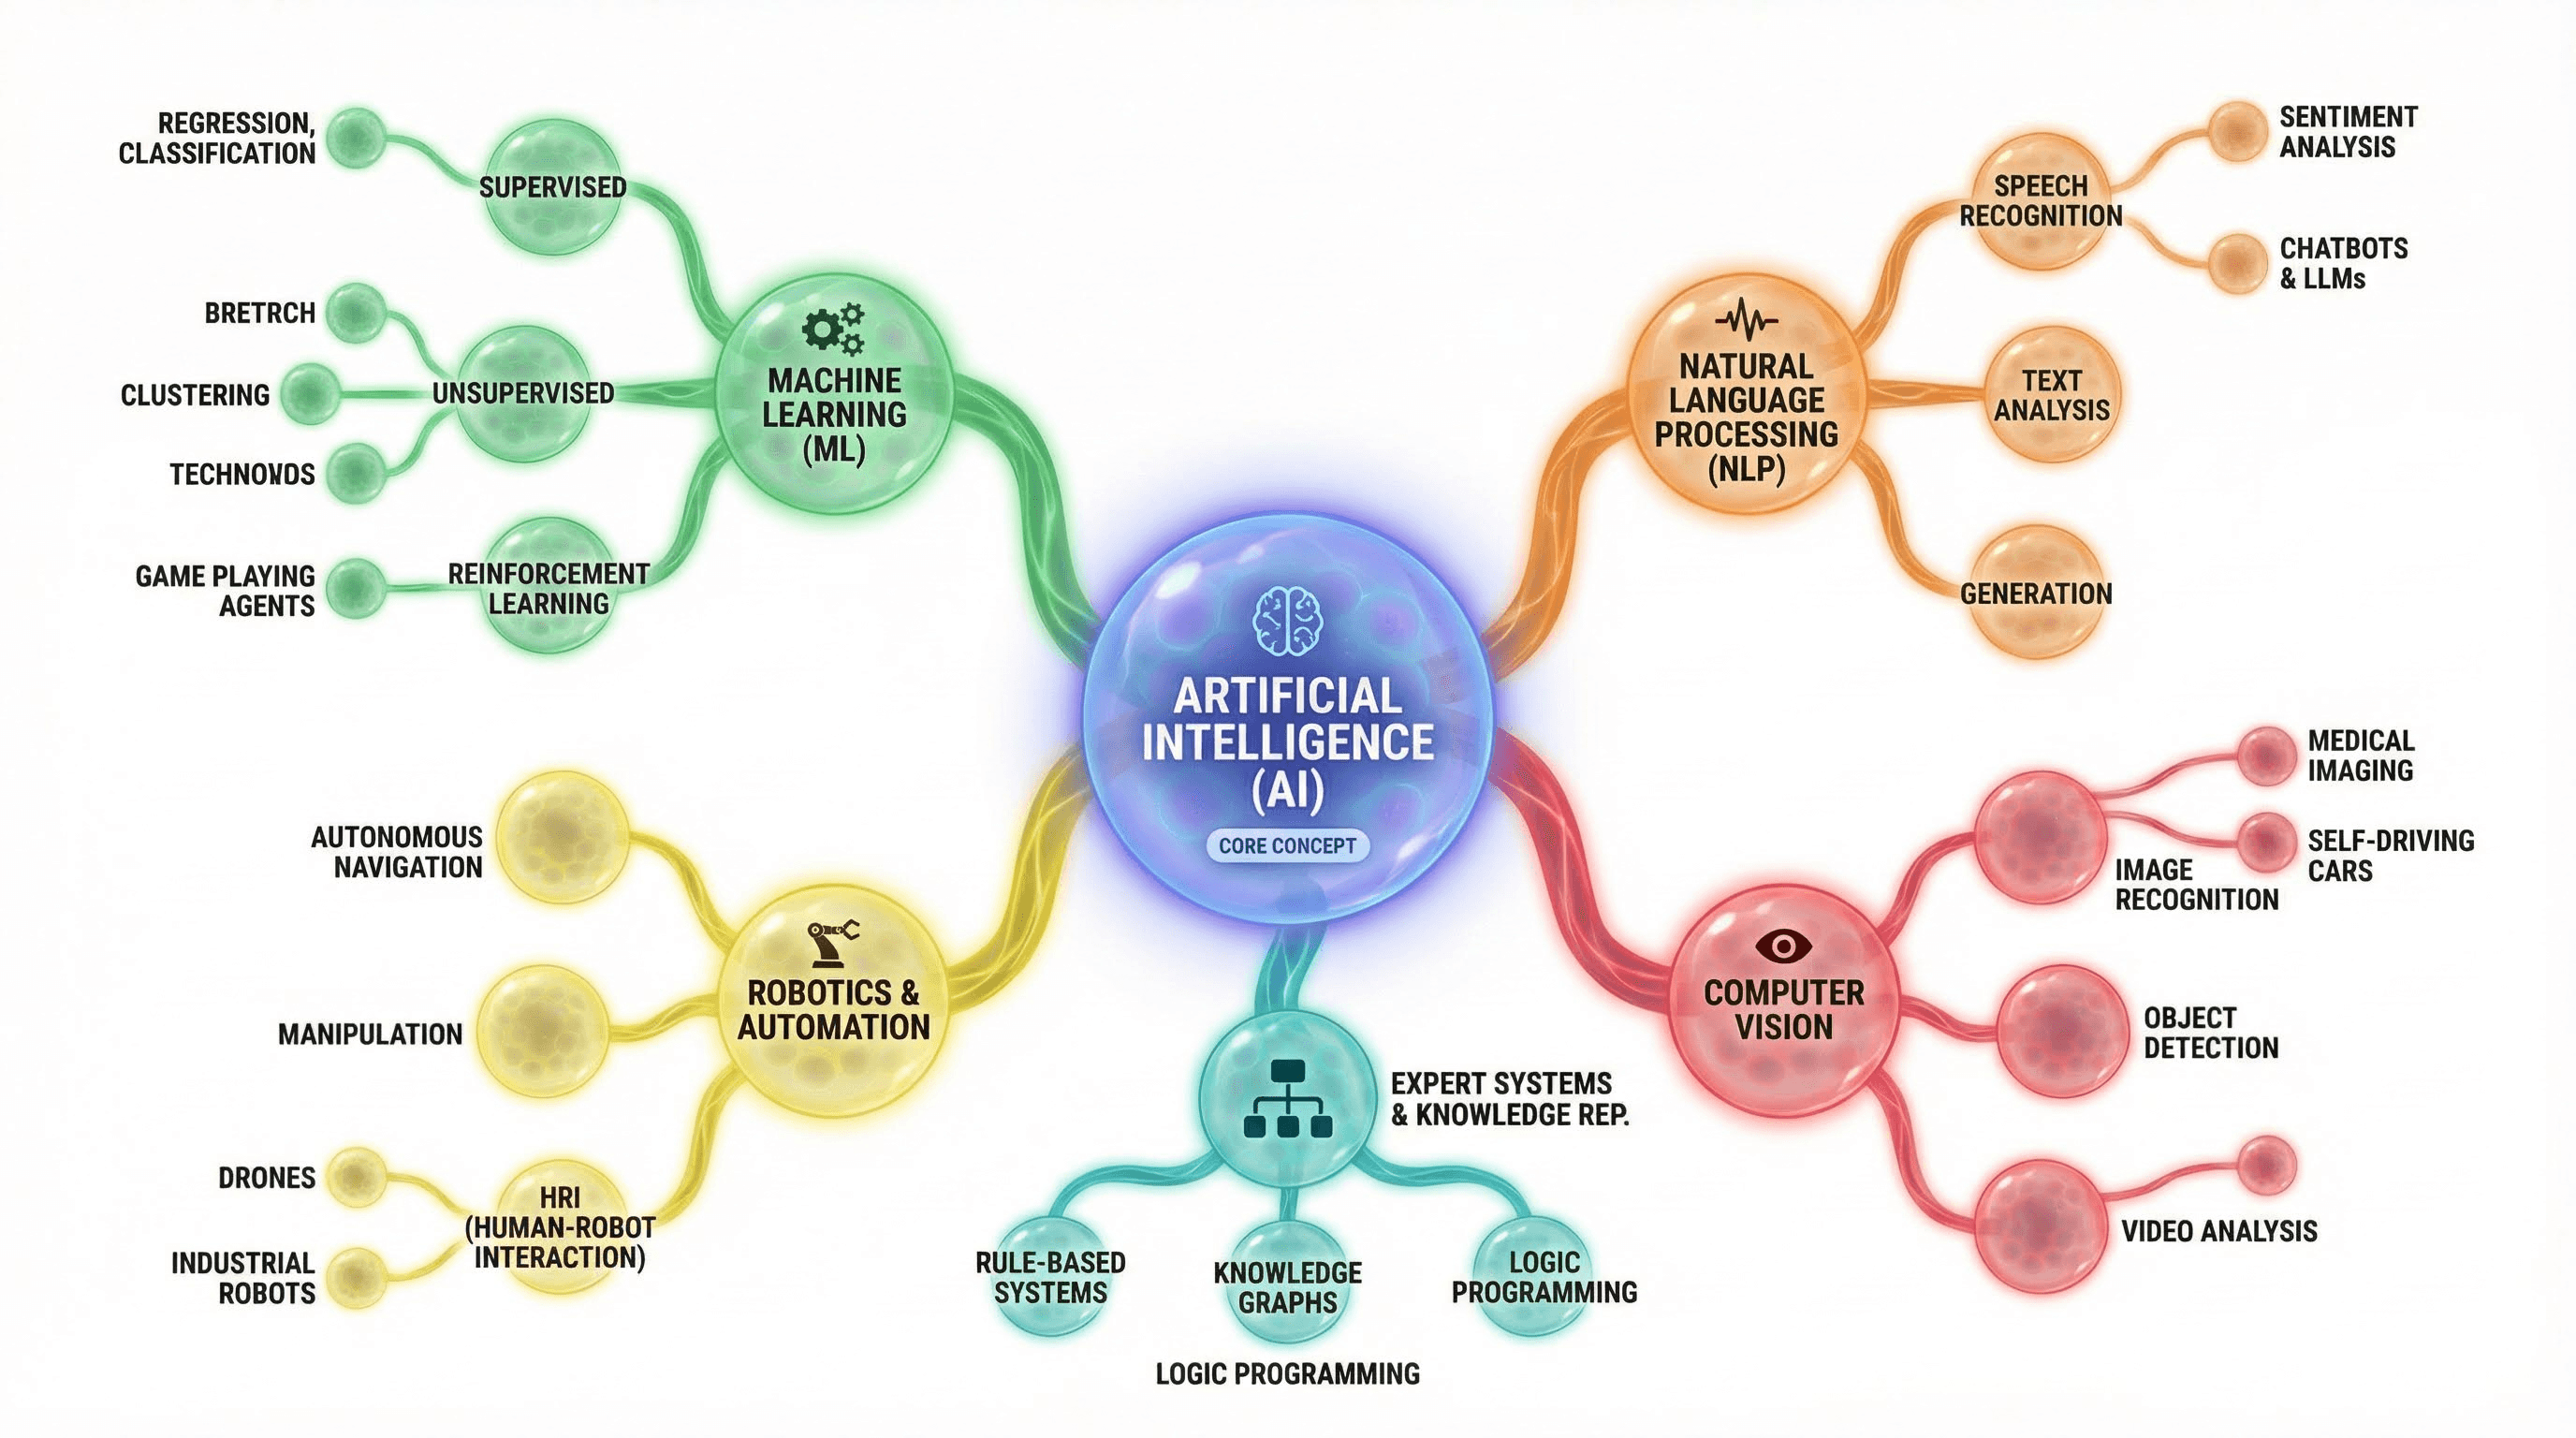
Create a complex mind-map infographic for [CONCEPT TOPIC]. Layout: Central node with organic branches extending outward. Visuals: Nodes are colored bubbles connected by curved bezier lines. Style: Organic, biological interface, clean UI. White background with colorful distinct branches.
Style: User experience, comic strip, narrative.
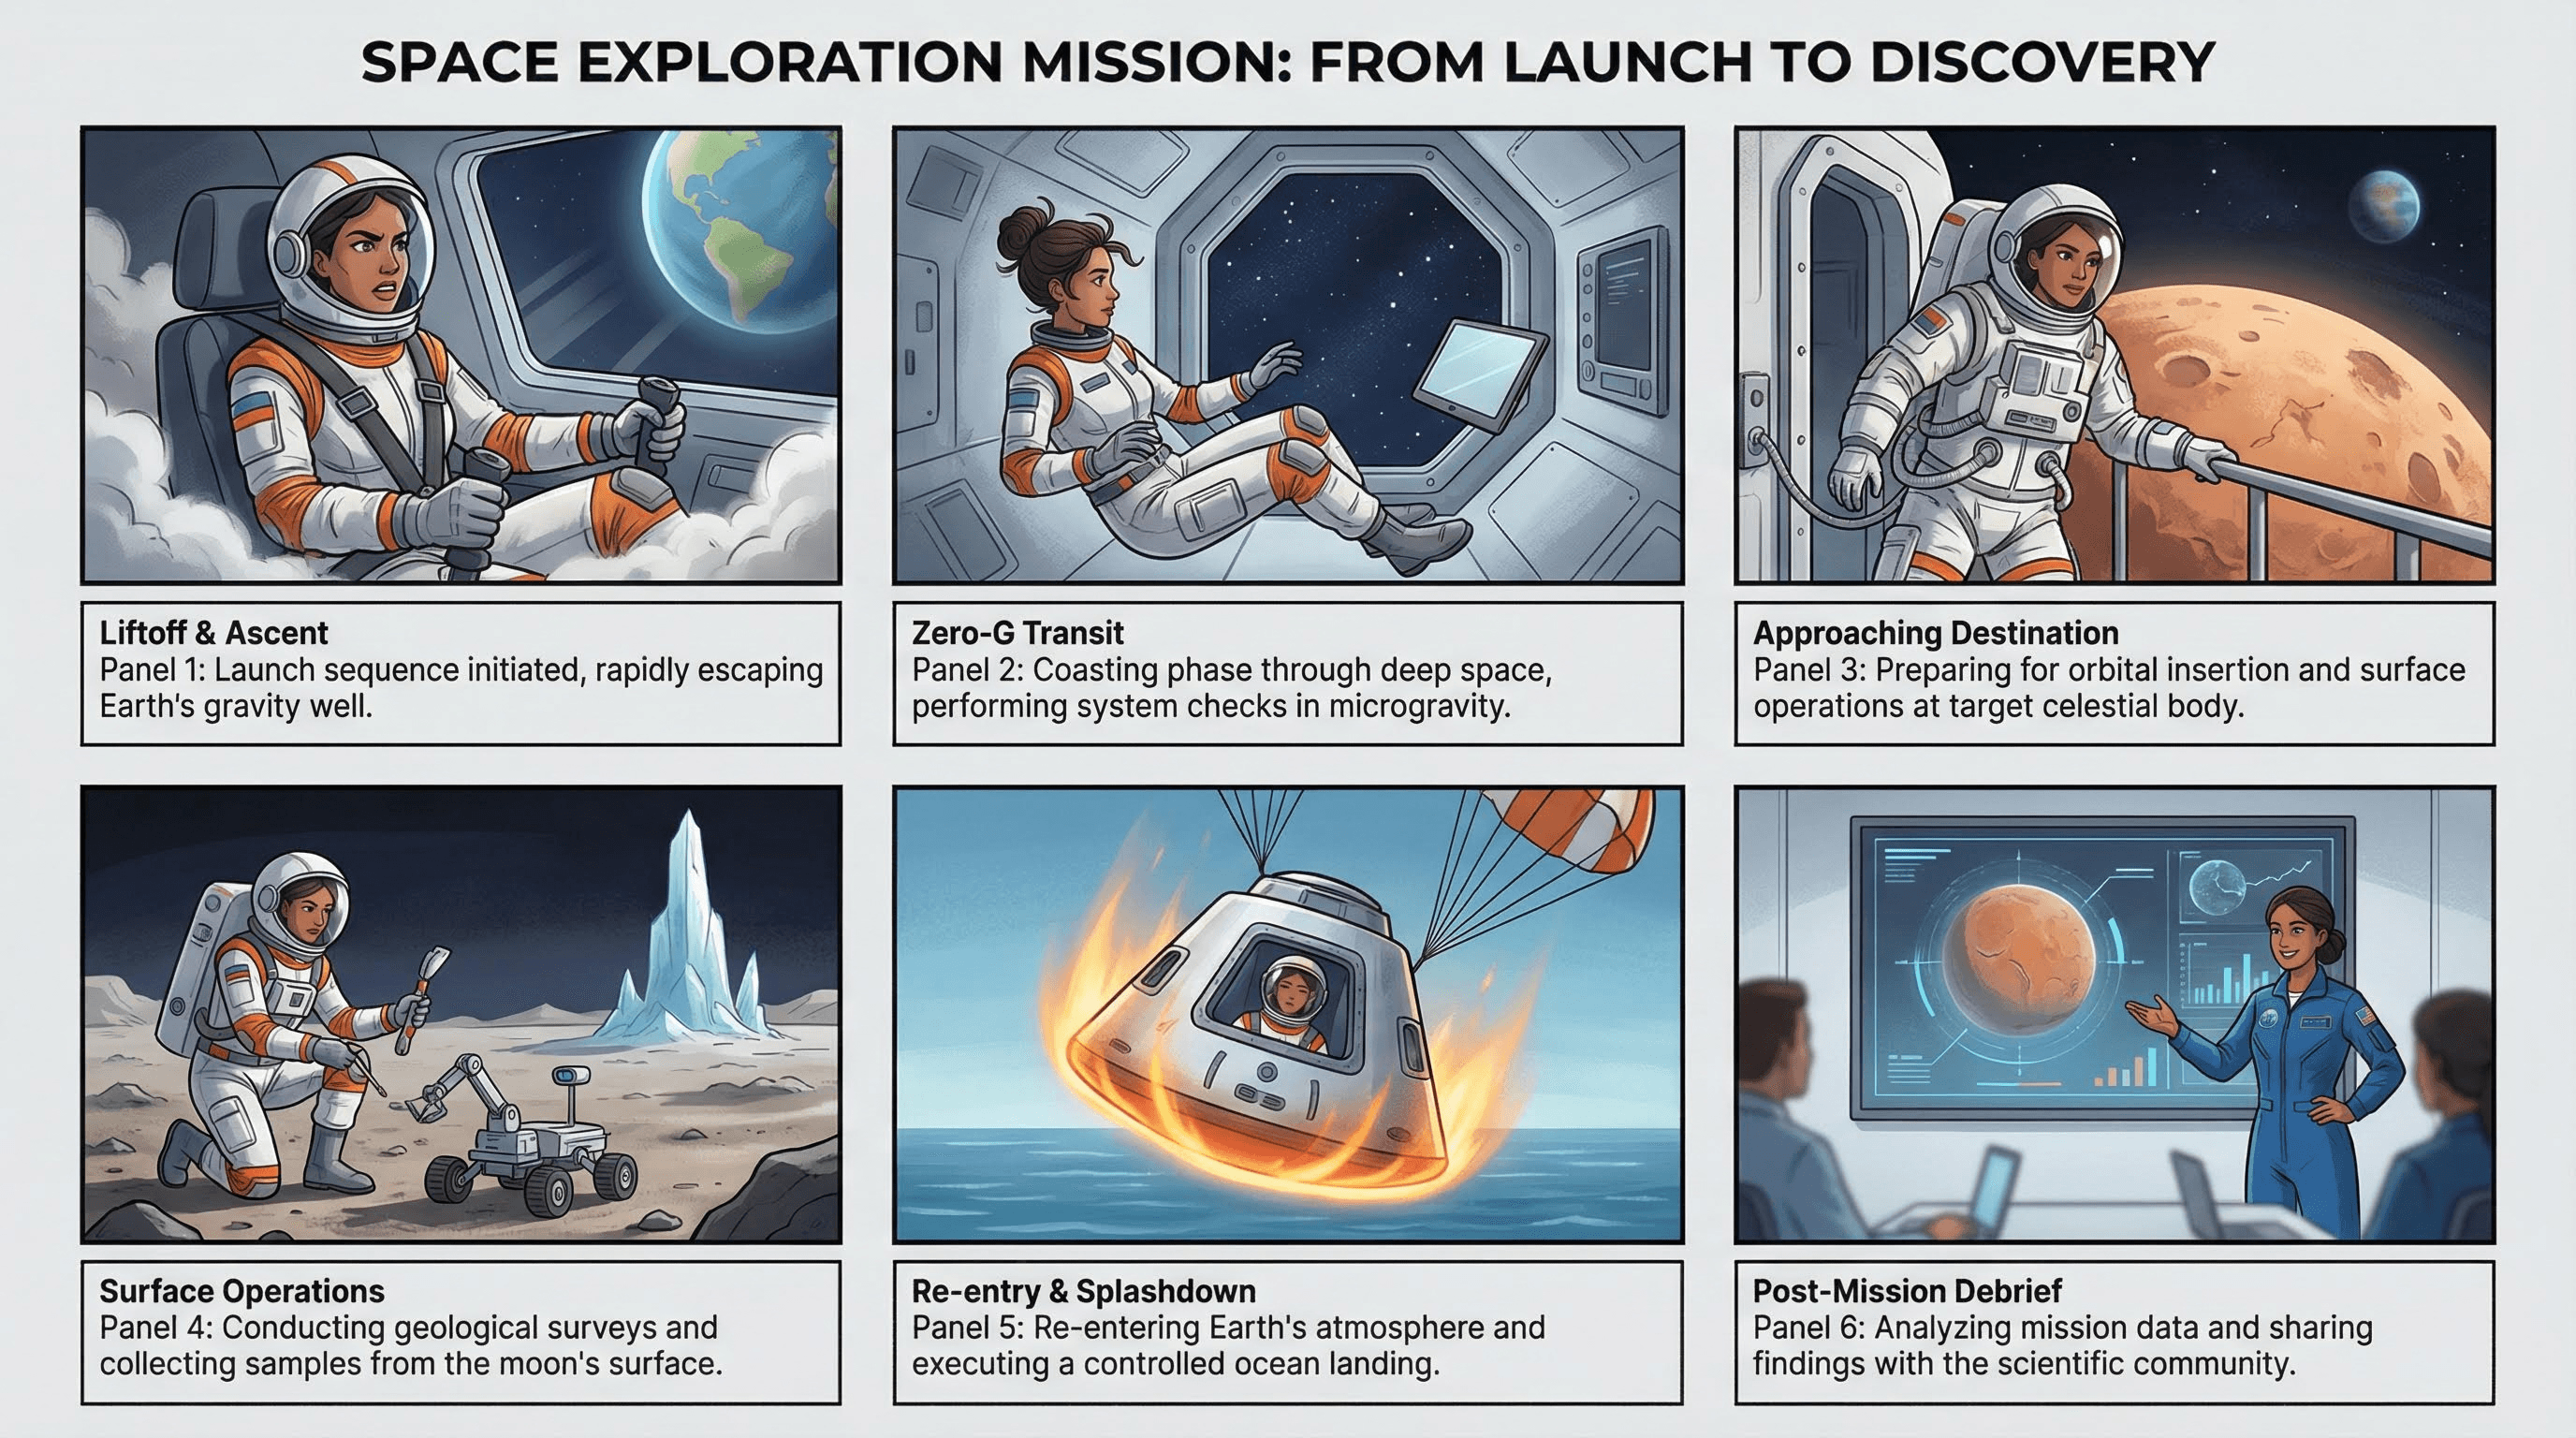
Generate a storyboard infographic visualizing [JOURNEY TOPIC]. Layout: 2 rows of 3 cinematic panels (comic strip style). Visuals: Consistent character moving through a scenario. Text: Captions under each frame. Style: Vector art, semi-realistic.
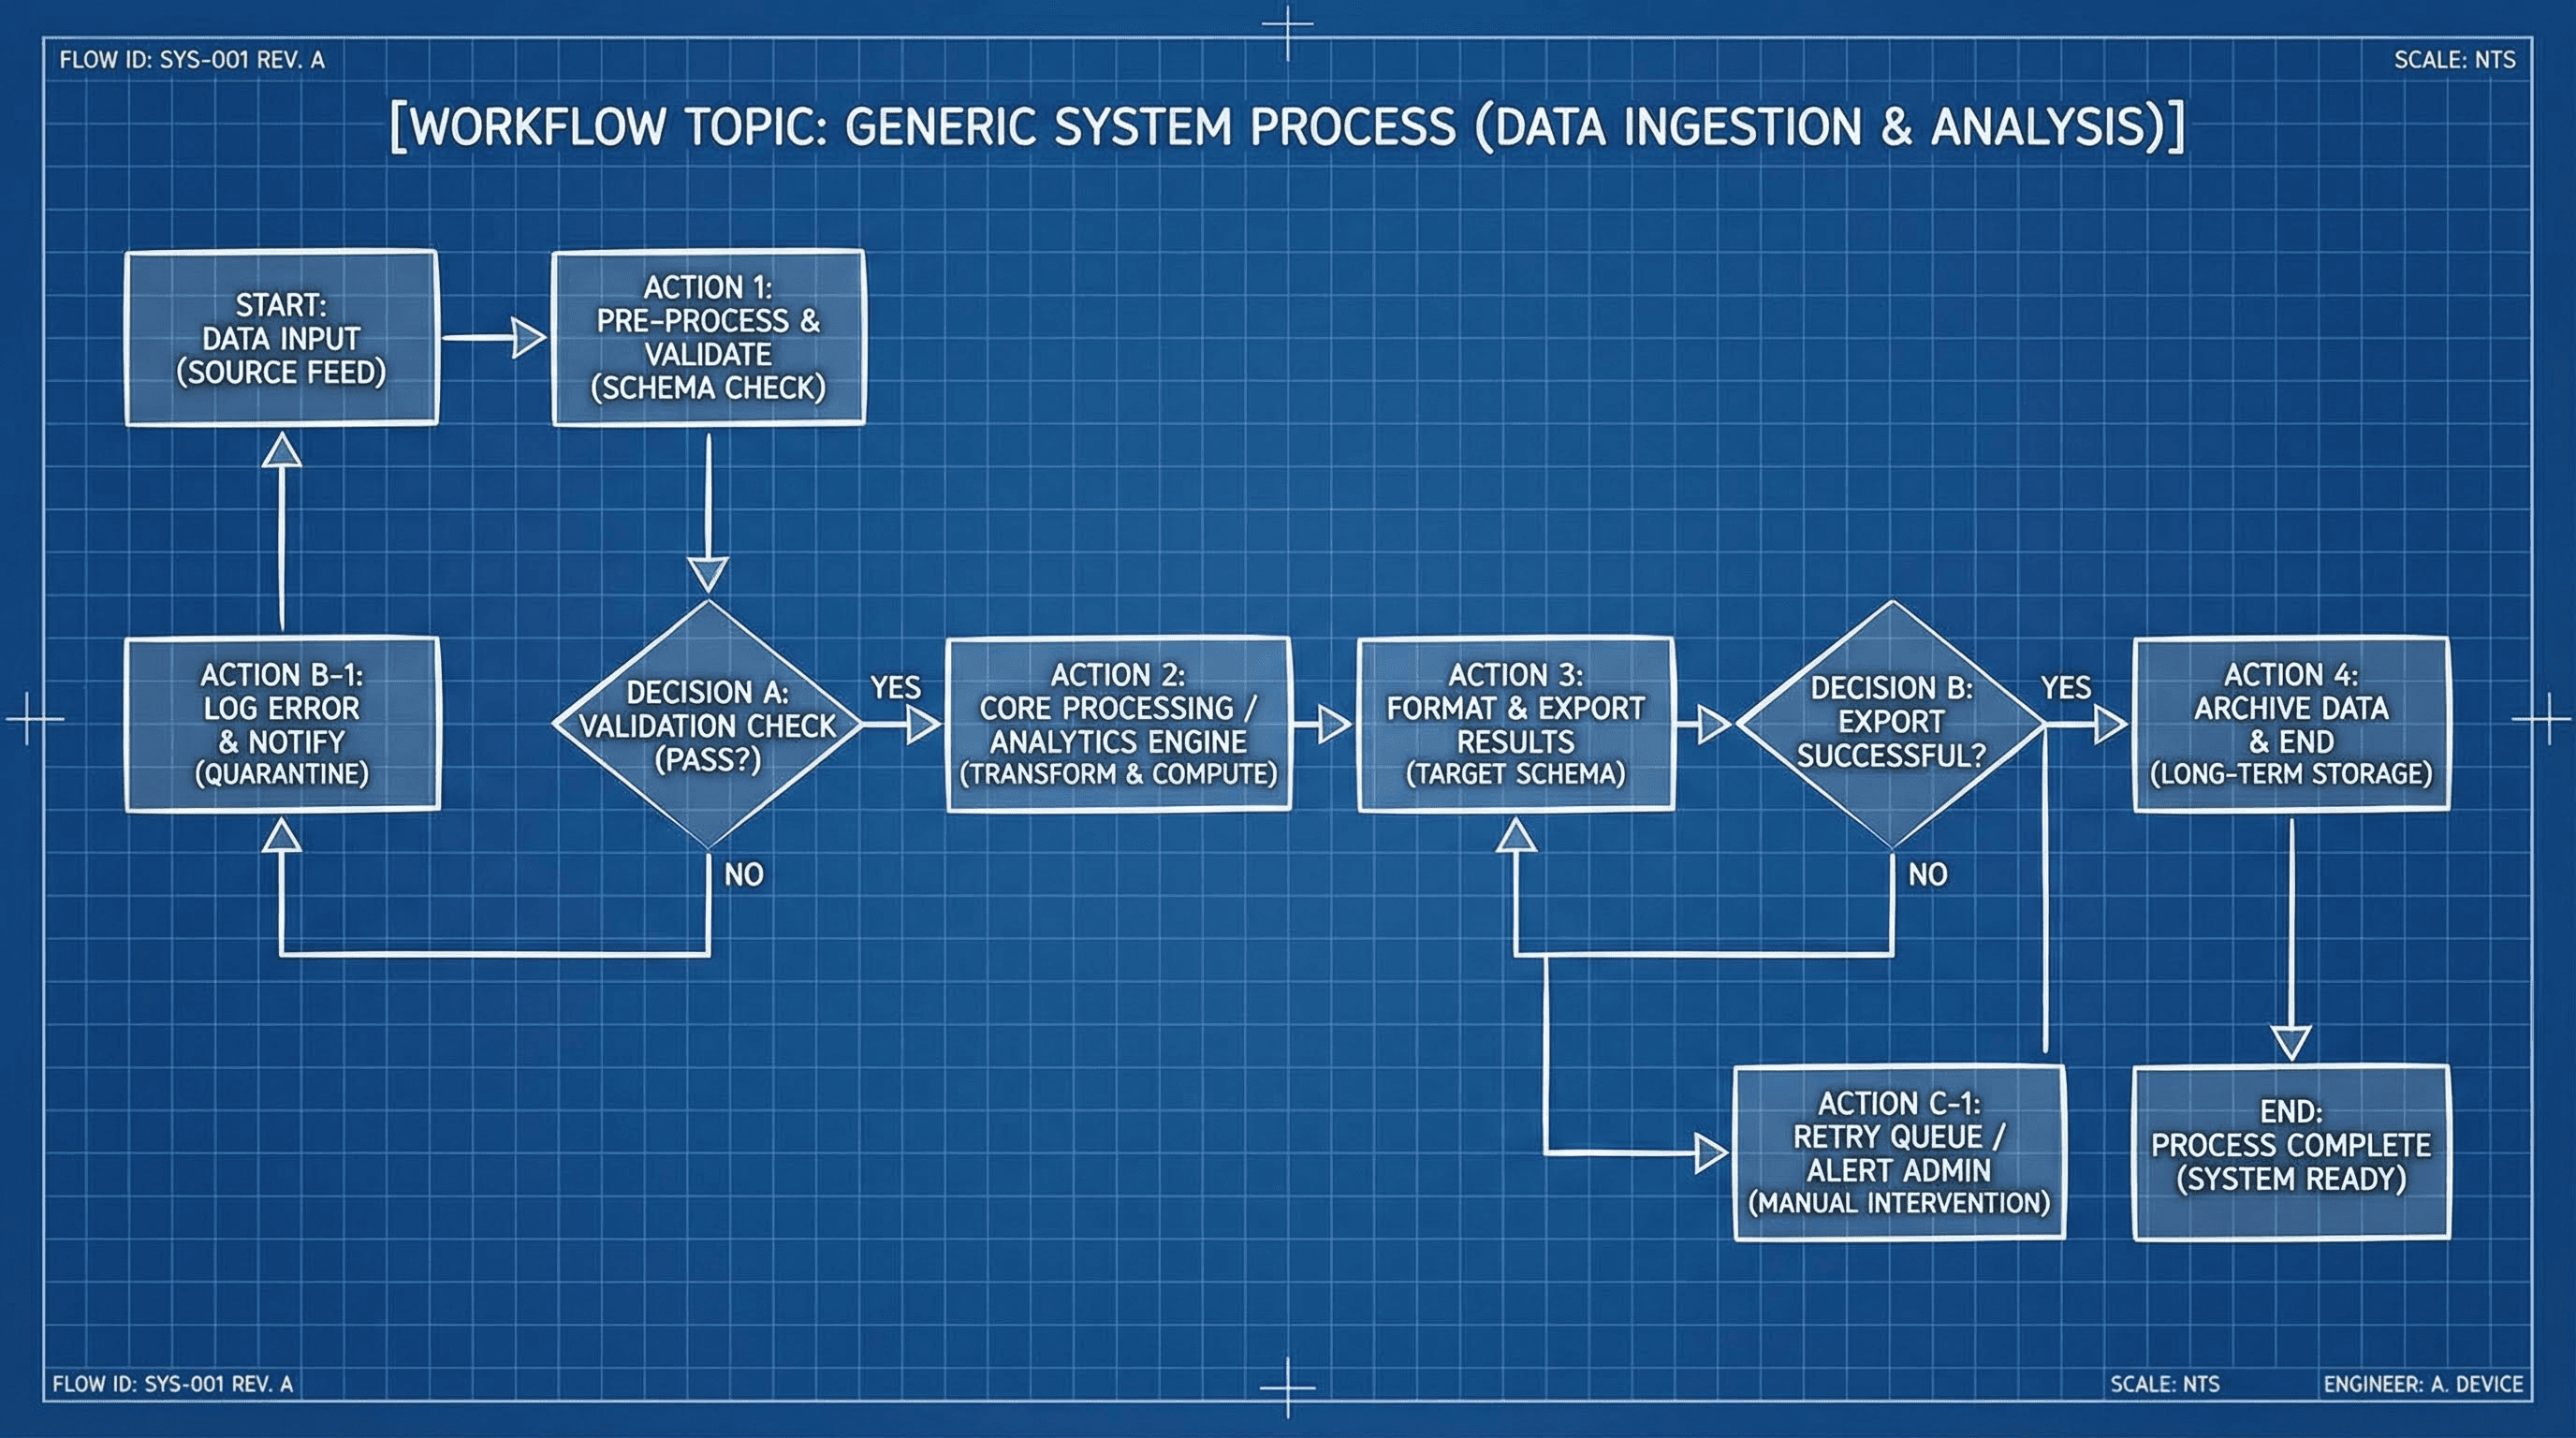
Style: Engineering, logic flow, algorithm.
Design a technical flow-chart infographic for [WORKFLOW TOPIC]. Visuals: Geometric shapes (diamonds for decisions, rectangles for actions). Connectors: Right-angle elbow arrows. Style: Blueprint aesthetic, blue background with white lines. High technical accuracy.
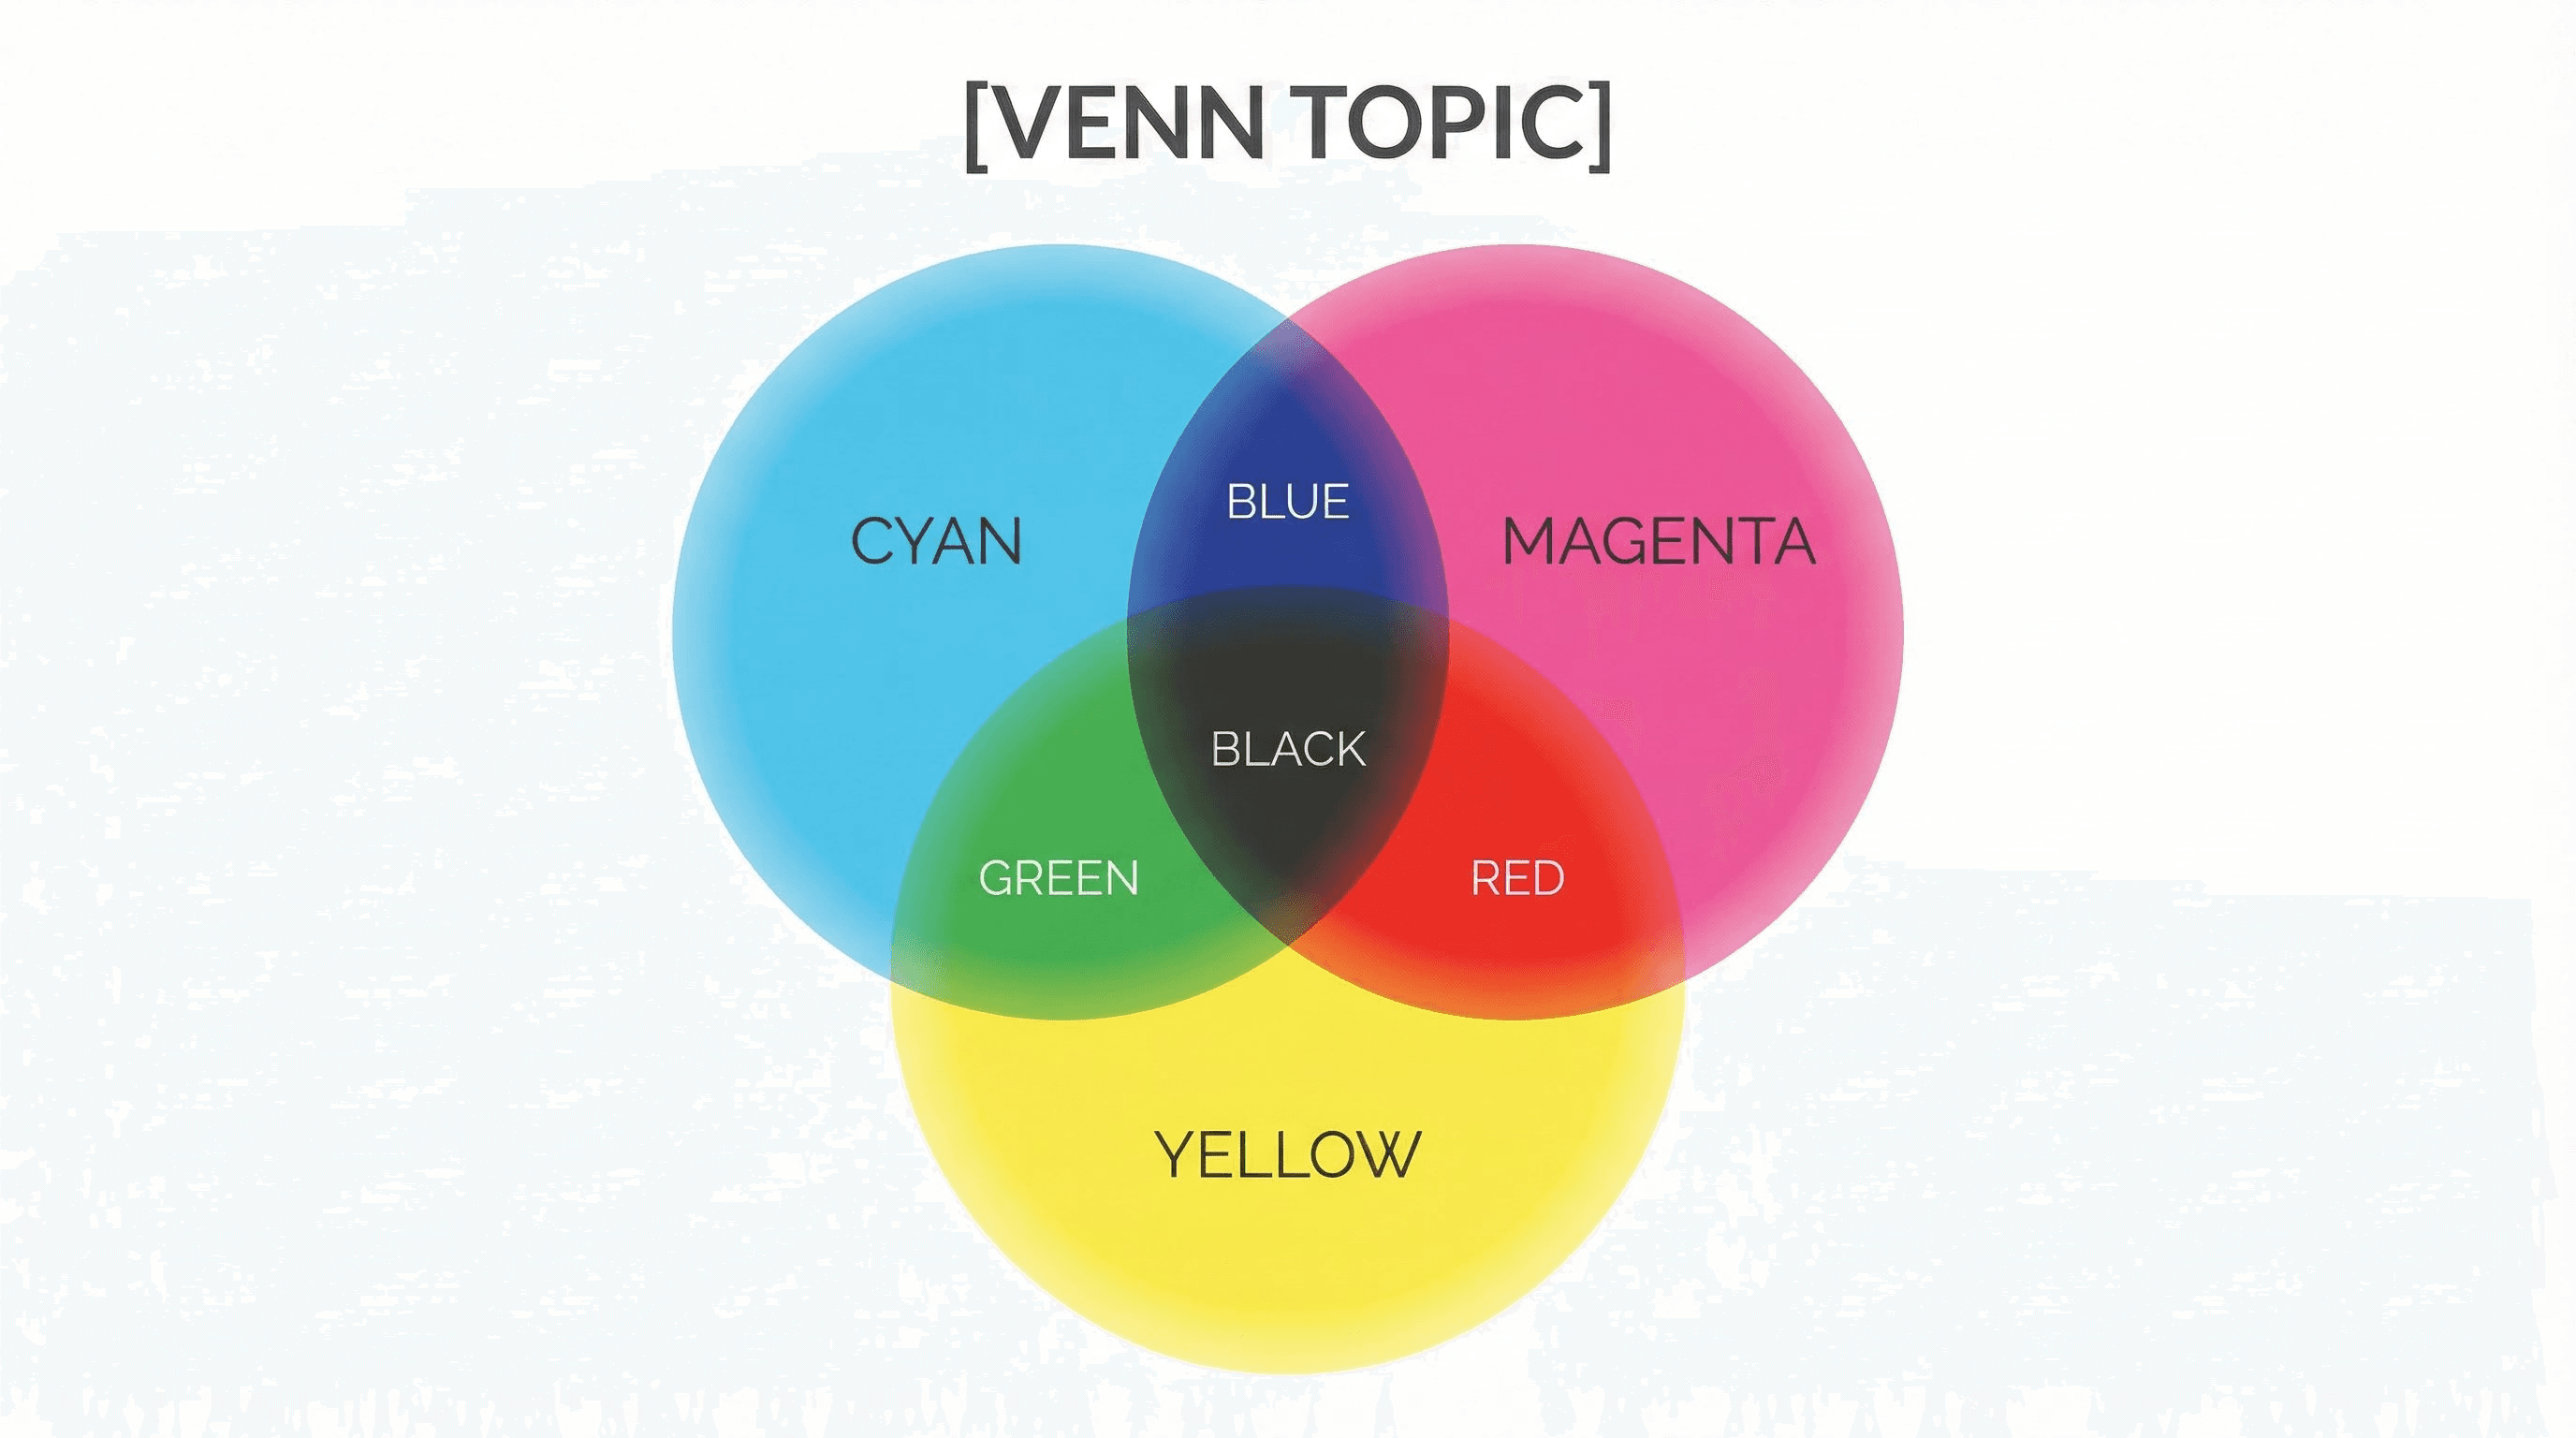
Style: Overlapping concepts, finding the "sweet spot".
Create a 3-circle Venn Diagram infographic for [VENN TOPIC]. Visuals: Large overlapping circles with transparency effects (multiply mode). Colors: Cyan, Magenta, Yellow (CMY) mixing to create secondary colors. Labels: Clearly placed in the center overlaps. Minimalist design.
Cluster 5: The Bonus Creative Suite
Best for: Viral hooks, fun concepts, and standing out.
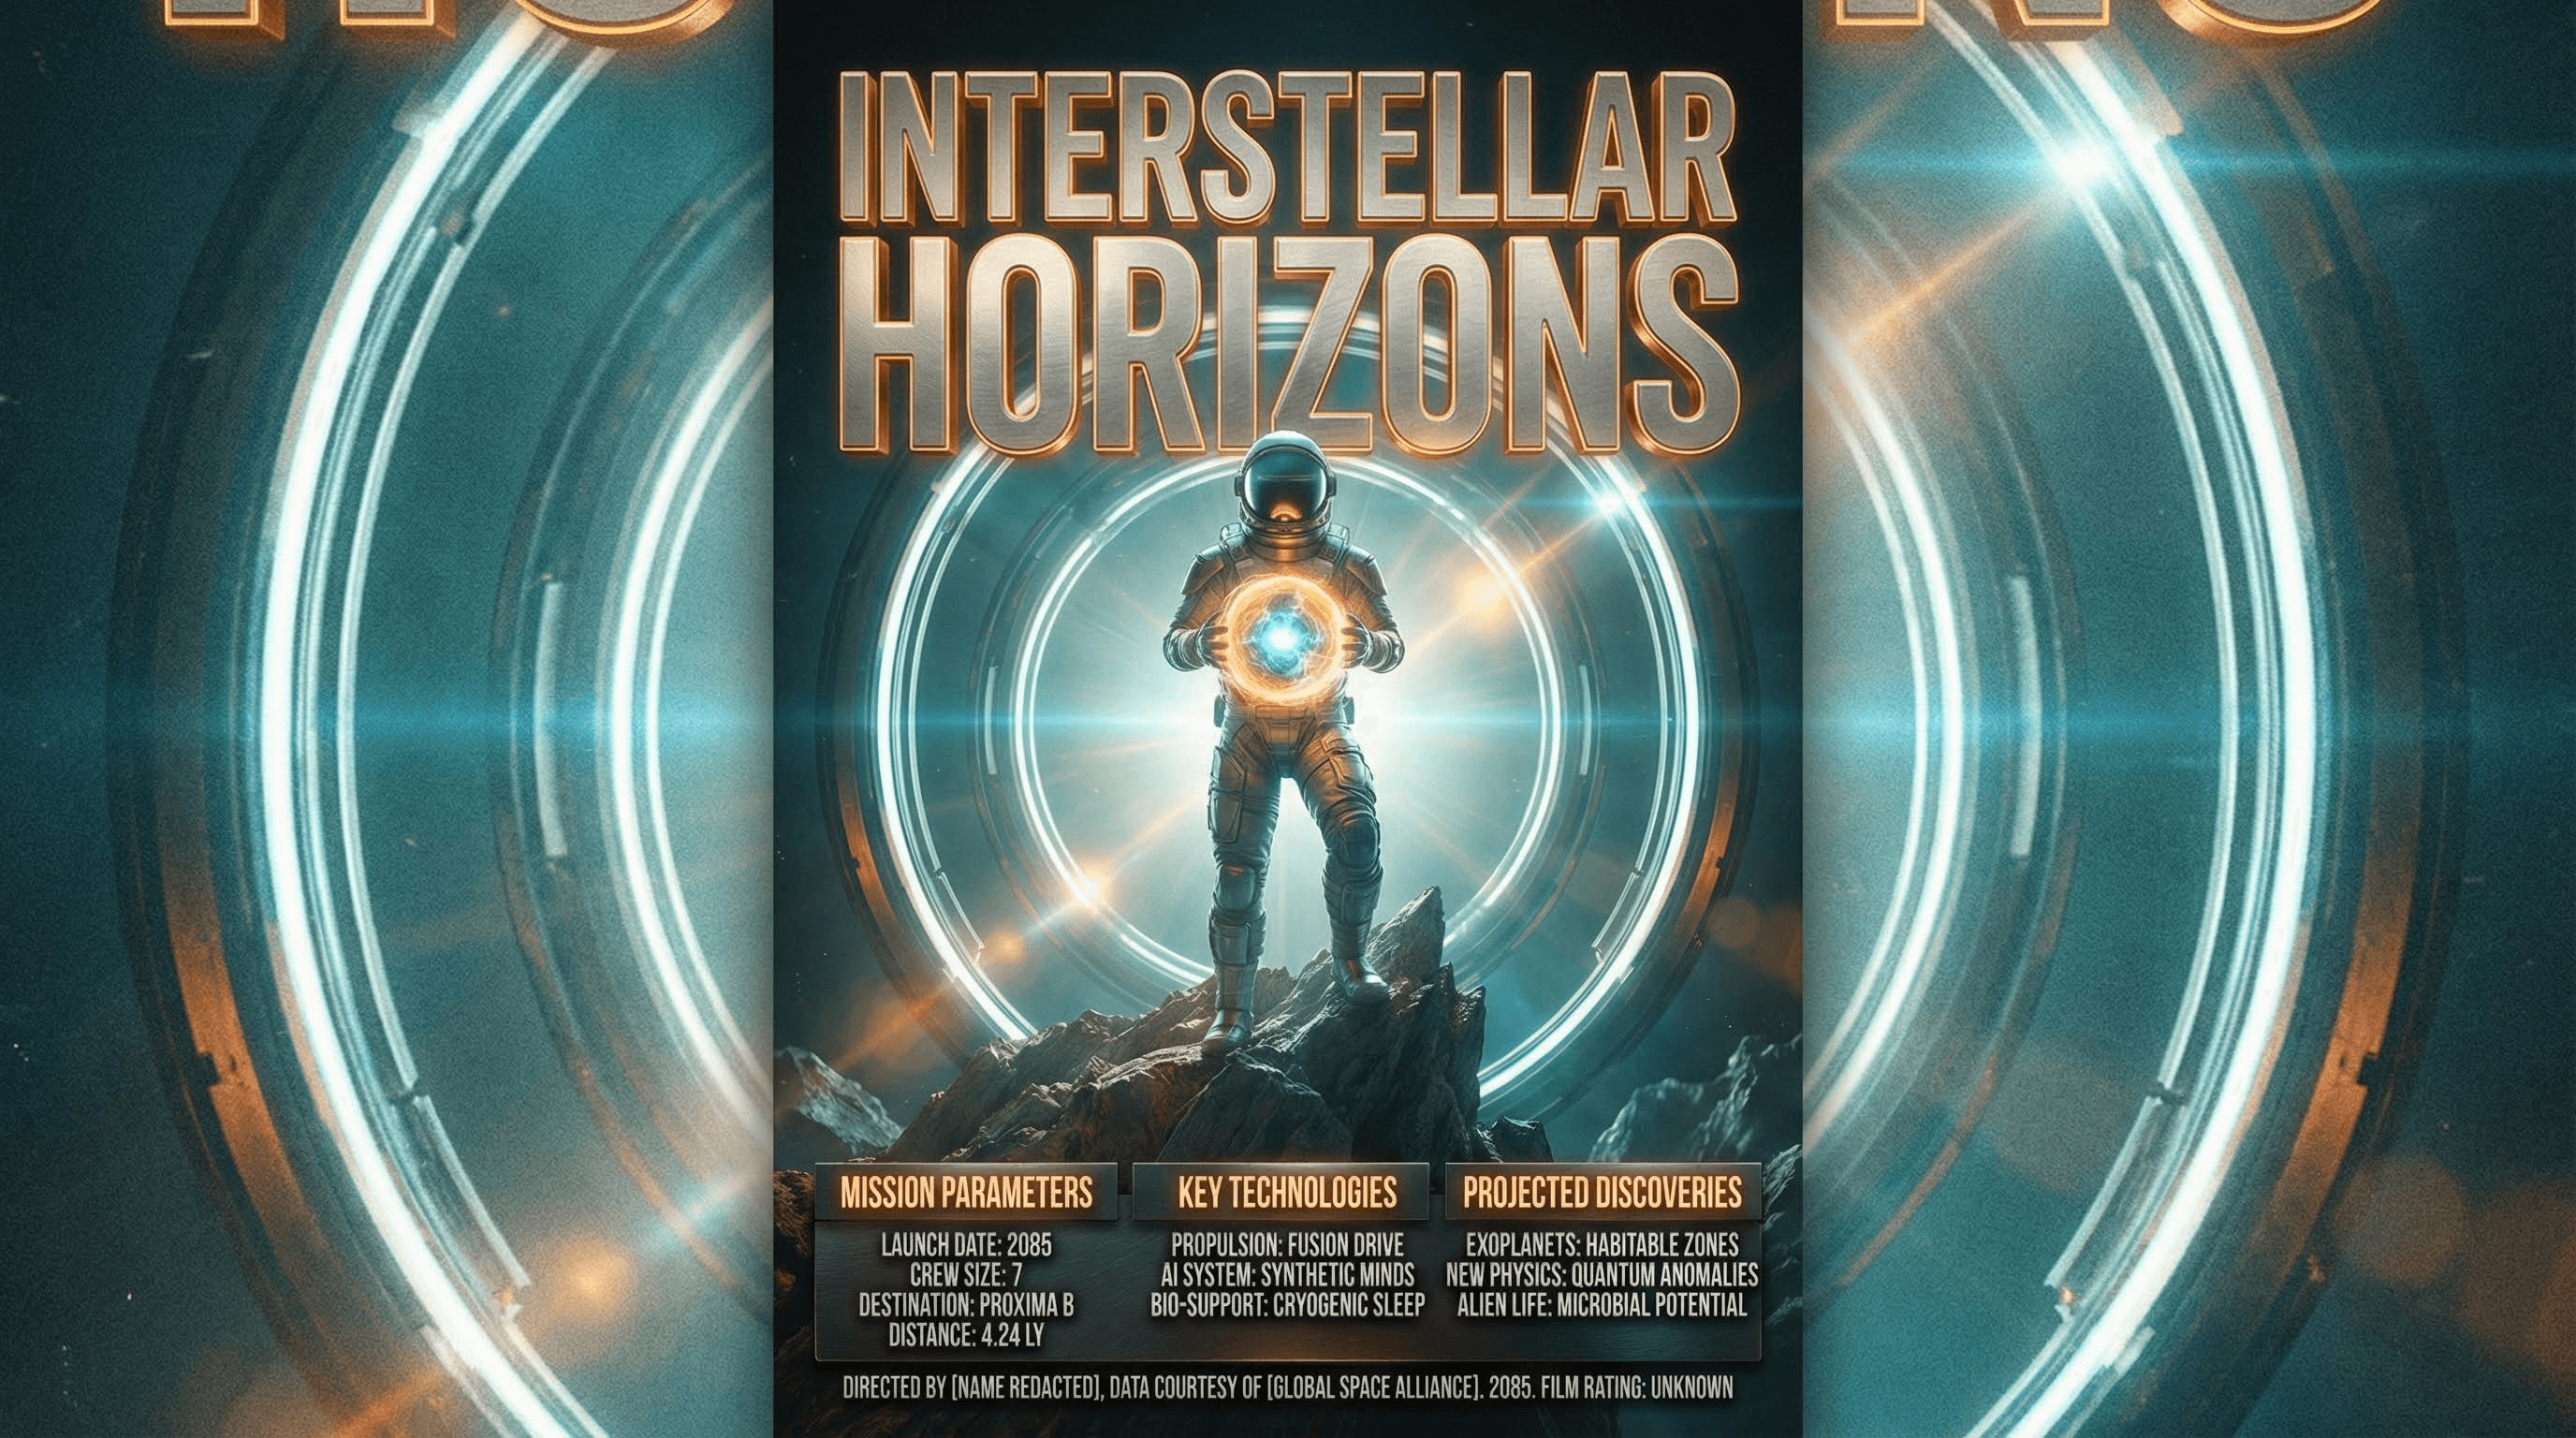
Style: Hollywood blockbuster, dramatic lighting.
Design a high-concept movie poster infographic for [TOPIC]. Style: Cinematic realism, dramatic lighting (teal and orange). Layout: Central hero character or object with credits-style text at the bottom for data points. Title: Massive, metallic 3D typography. Texture: Film grain, lens flare.
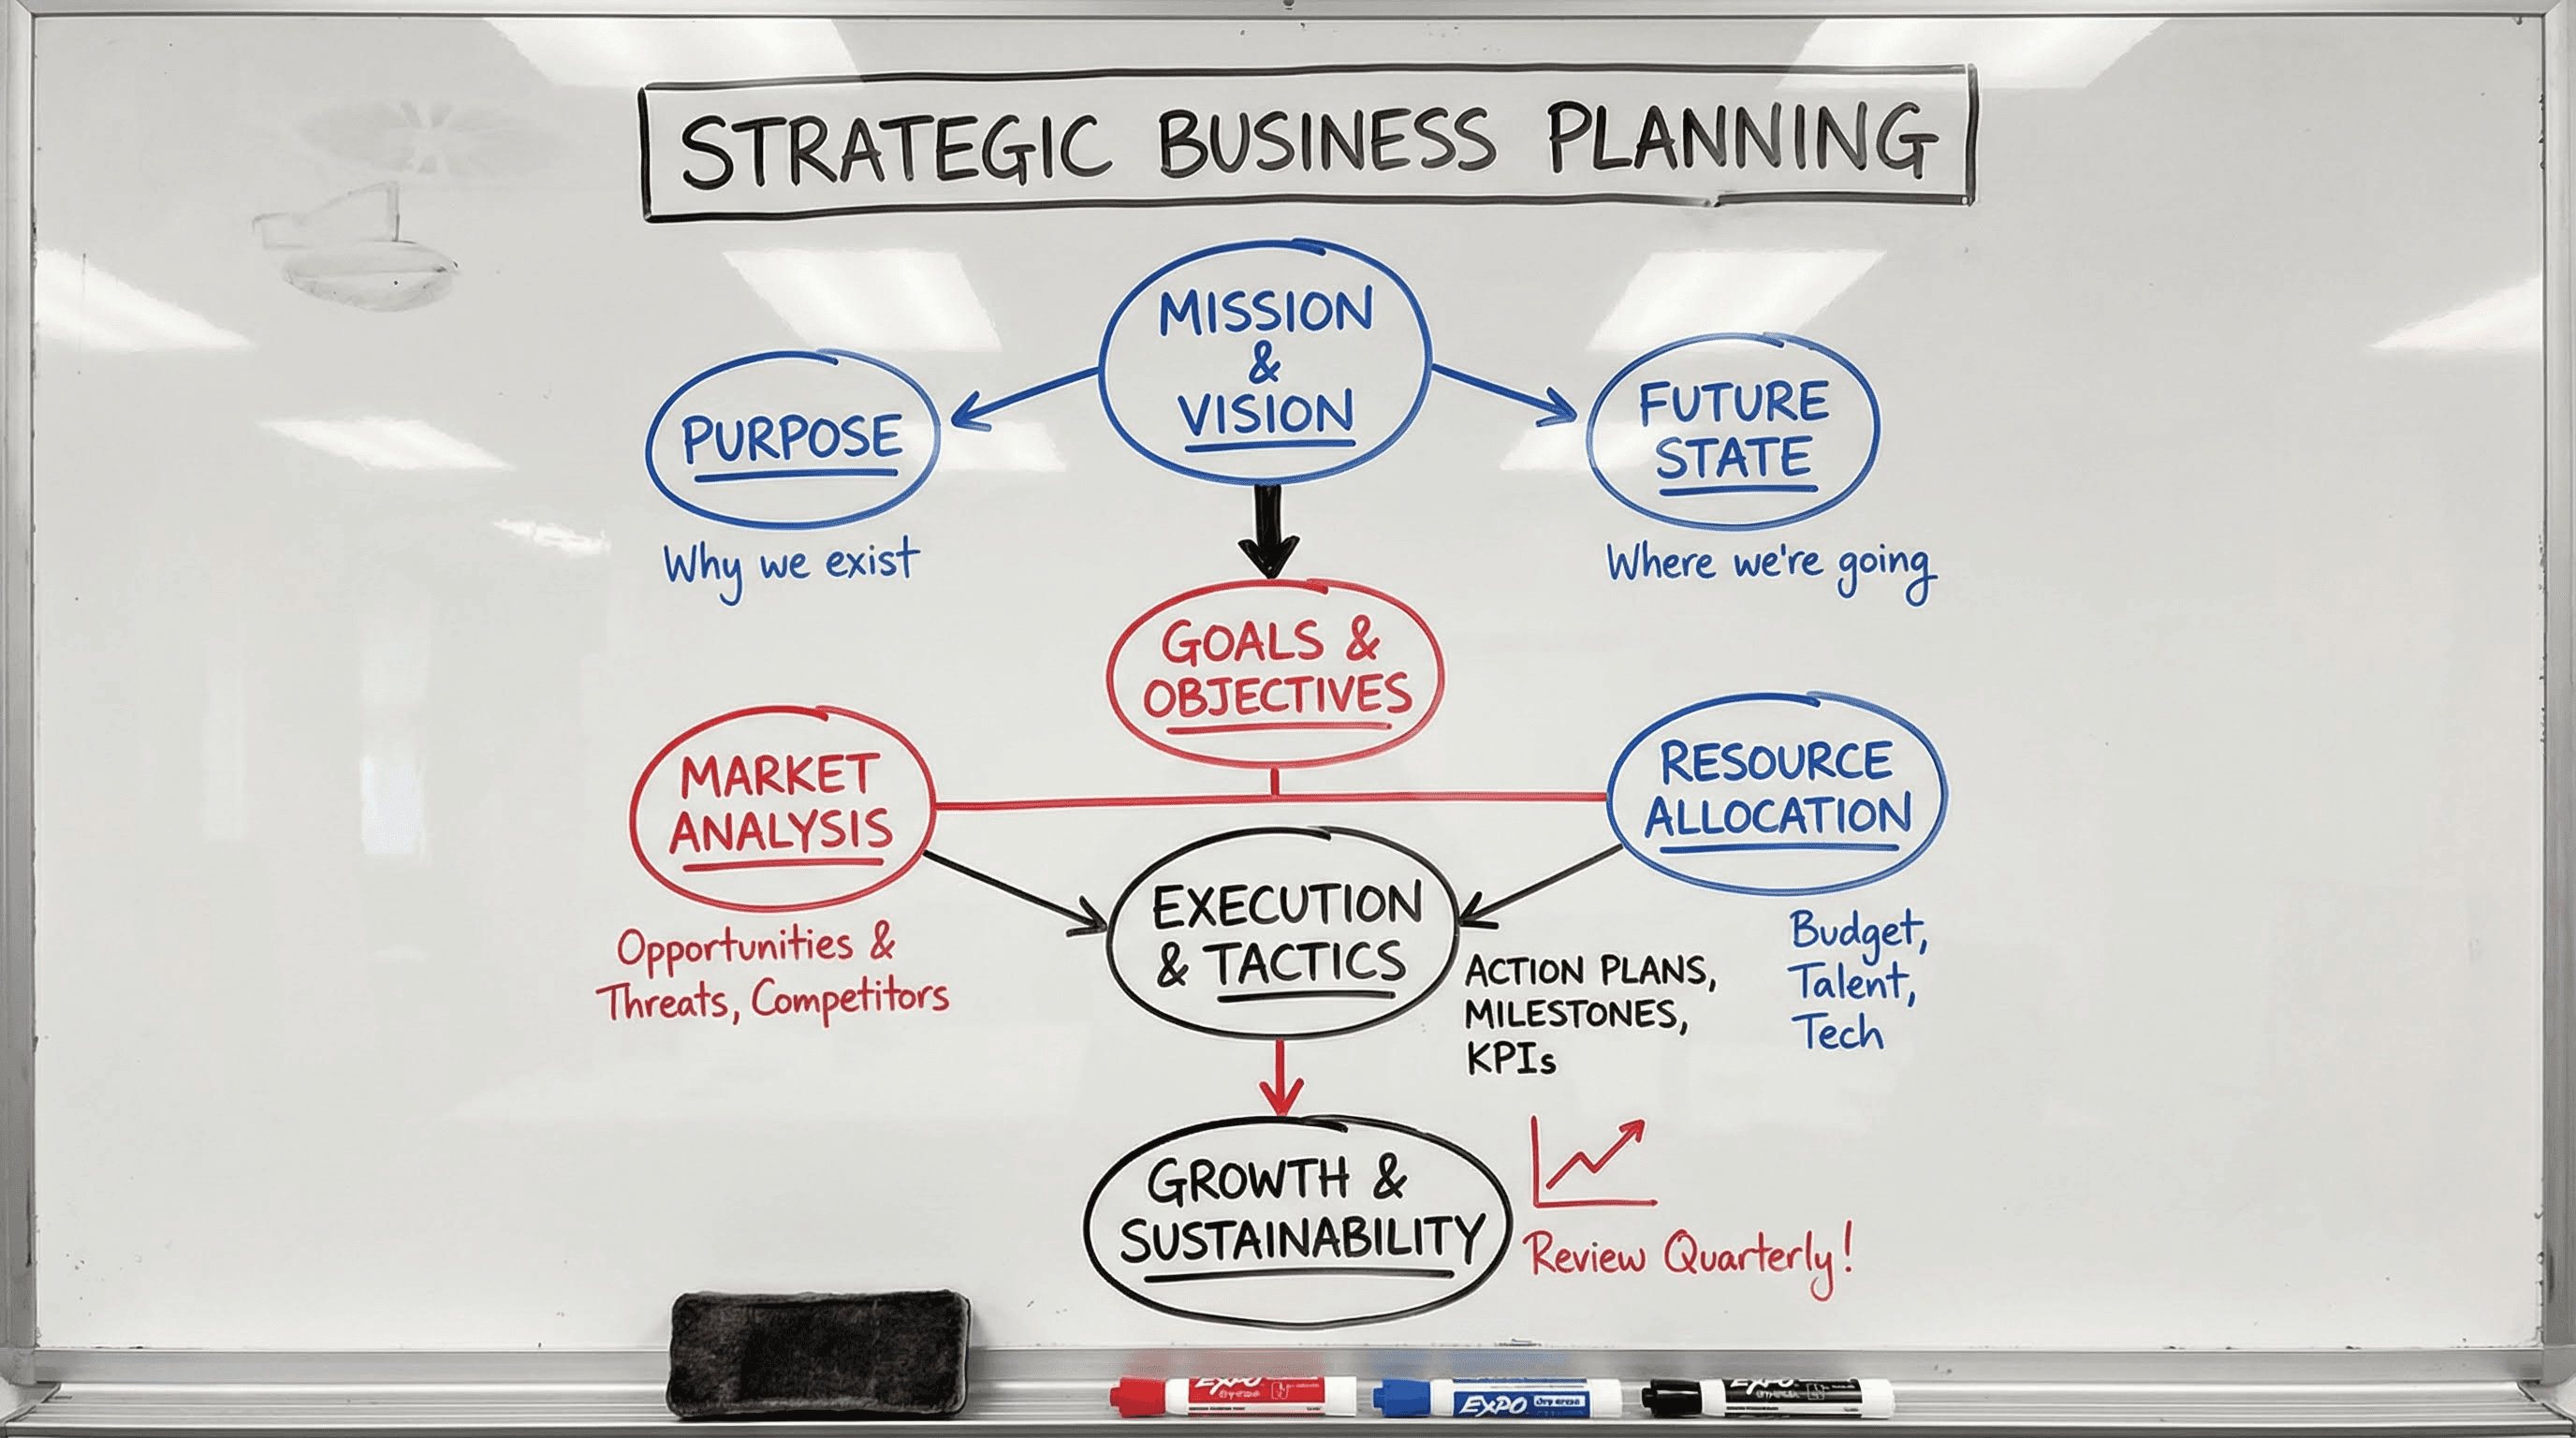
Style: Startup war room, dry-erase markers.
Create a realistic whiteboard infographic for [TOPIC]. Visuals: Photo-realistic whiteboard surface with reflection. Content: Drawn with red, blue, and black dry-erase markers. Handwriting: Messy but legible cursive and block letters. Diagrams: Circles, arrows, and underlined key terms. Lighting: Office fluorescent overhead.
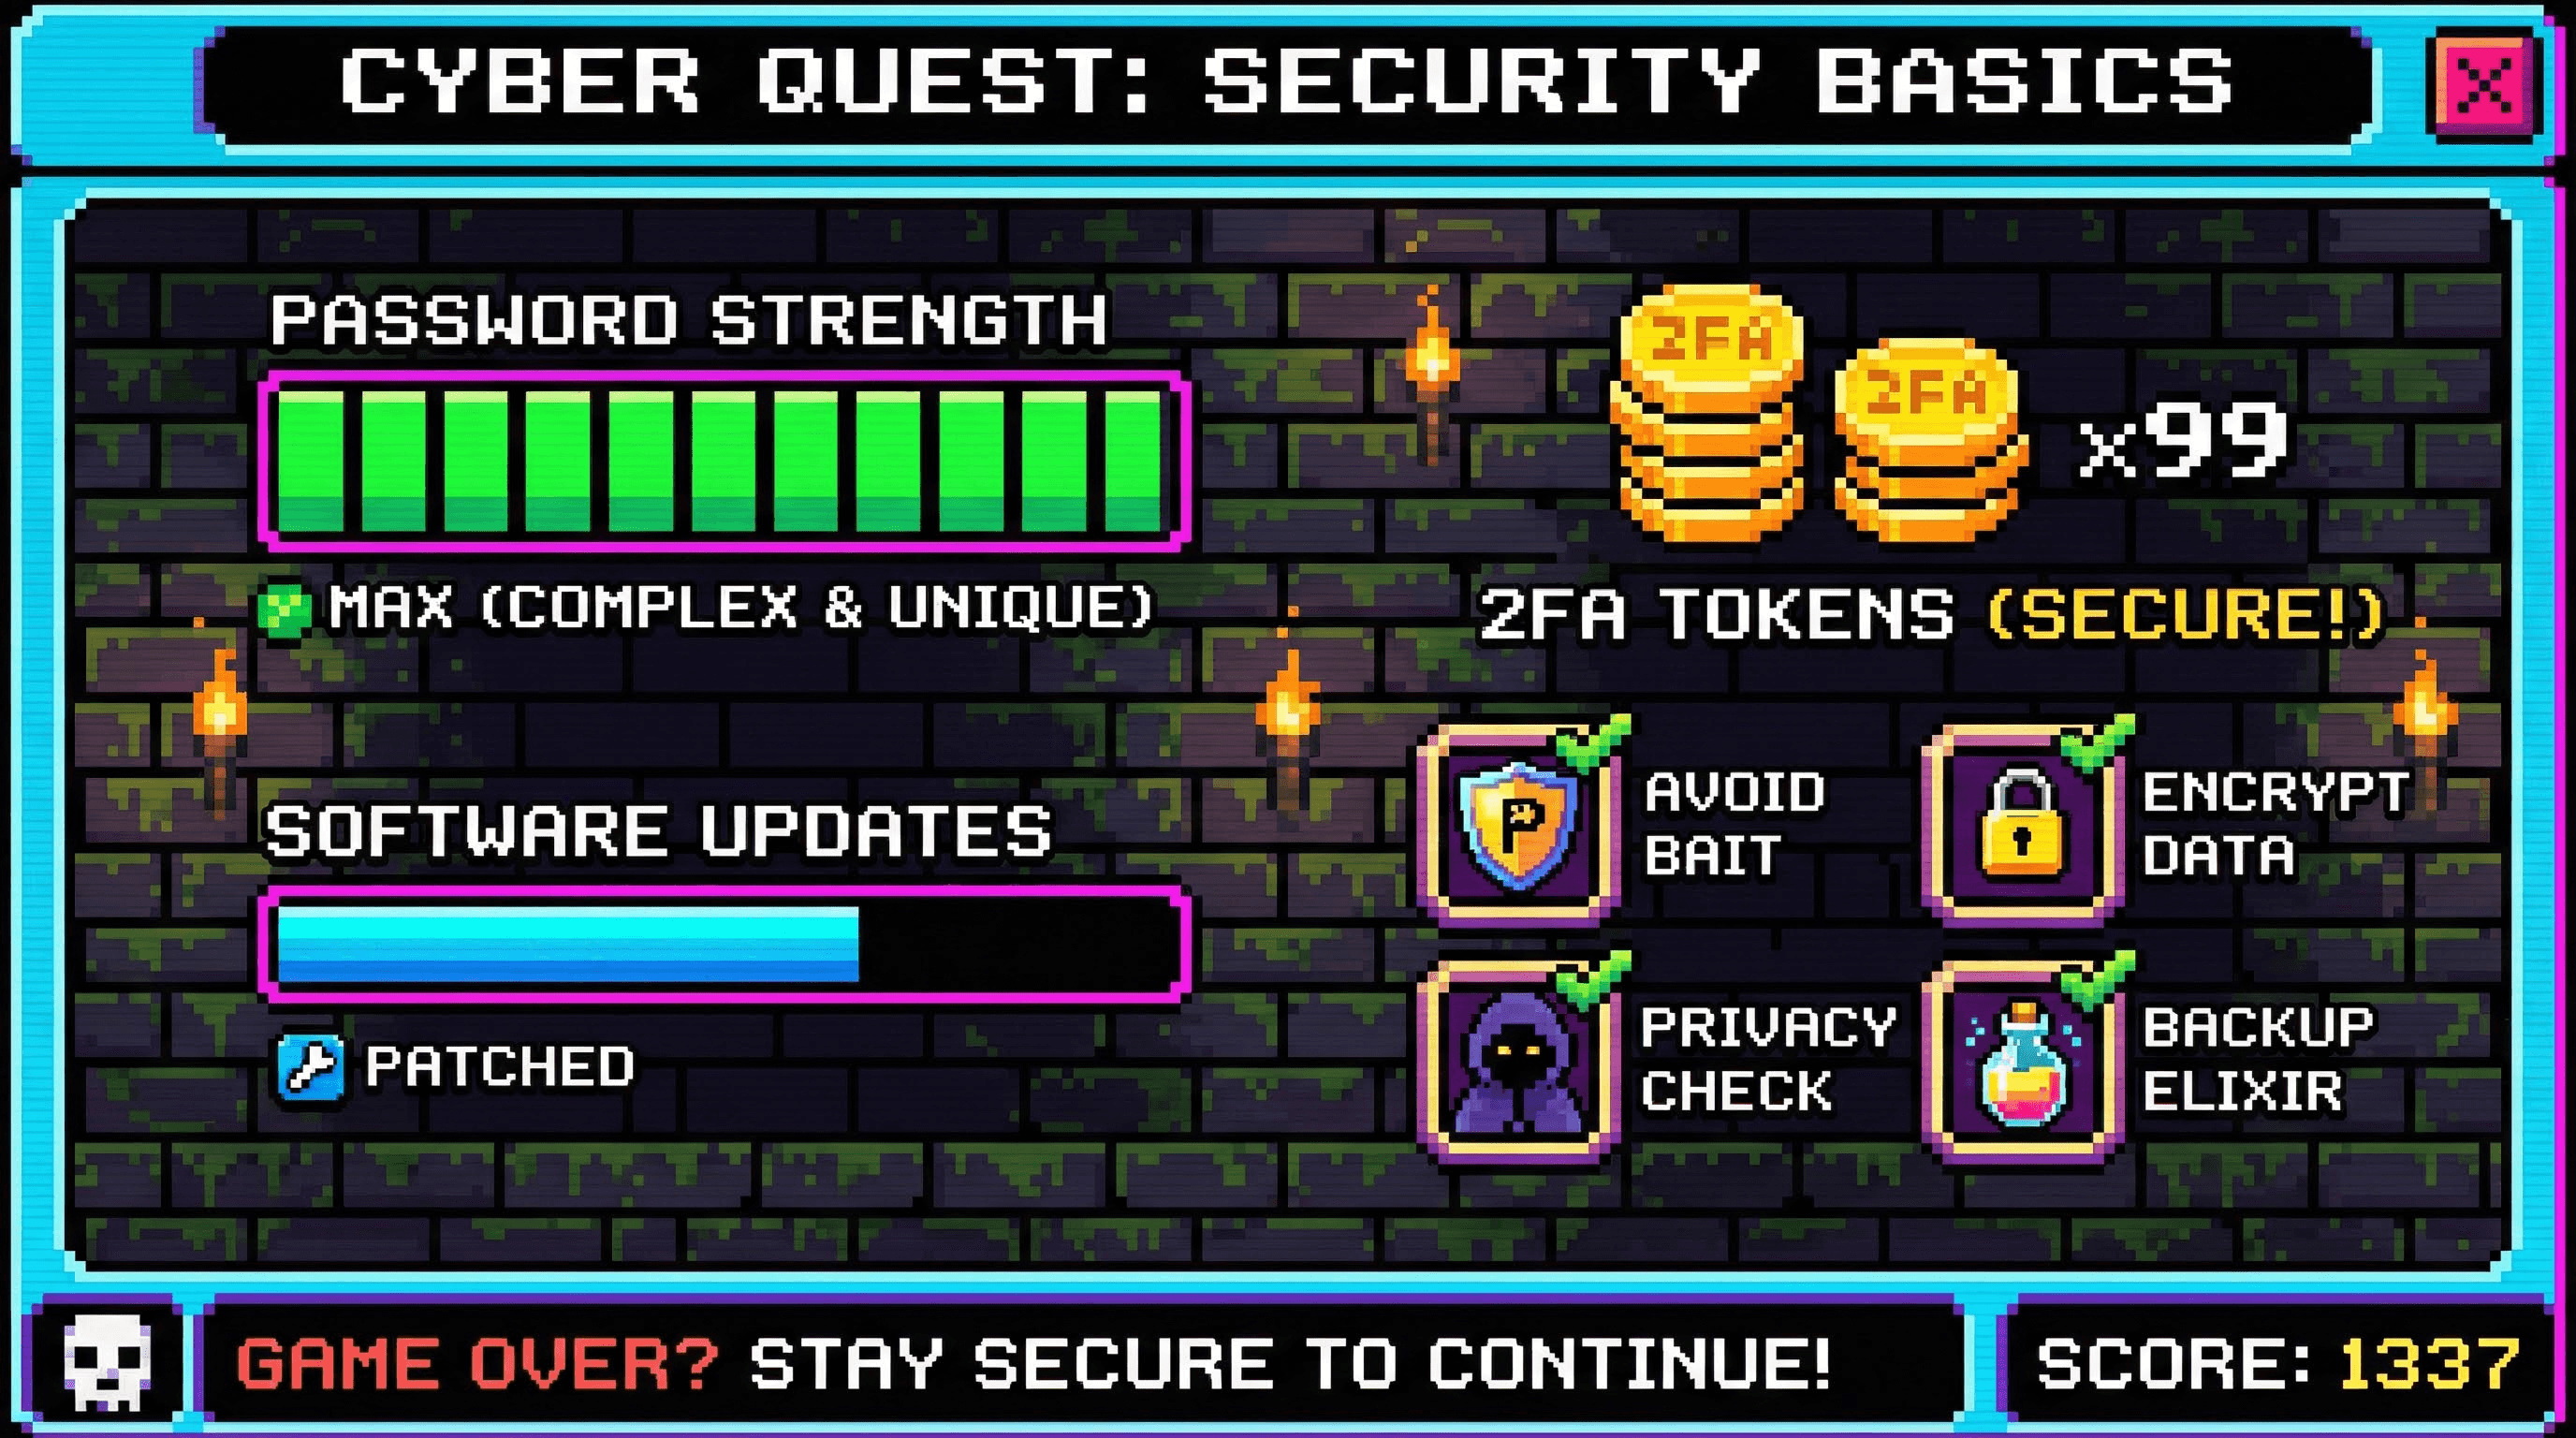
Style: Pixel art, NES era, nostalgia.
Generate a pixel-art infographic for [TOPIC]. Style: 8-bit video game aesthetic. Layout: Game UI screen. Data points: Represented as health bars, coin counts, or inventory slots. Background: Starfield or dungeon brick pattern. Font: Arcade pixel font. Palette: Limited vibrant palette.
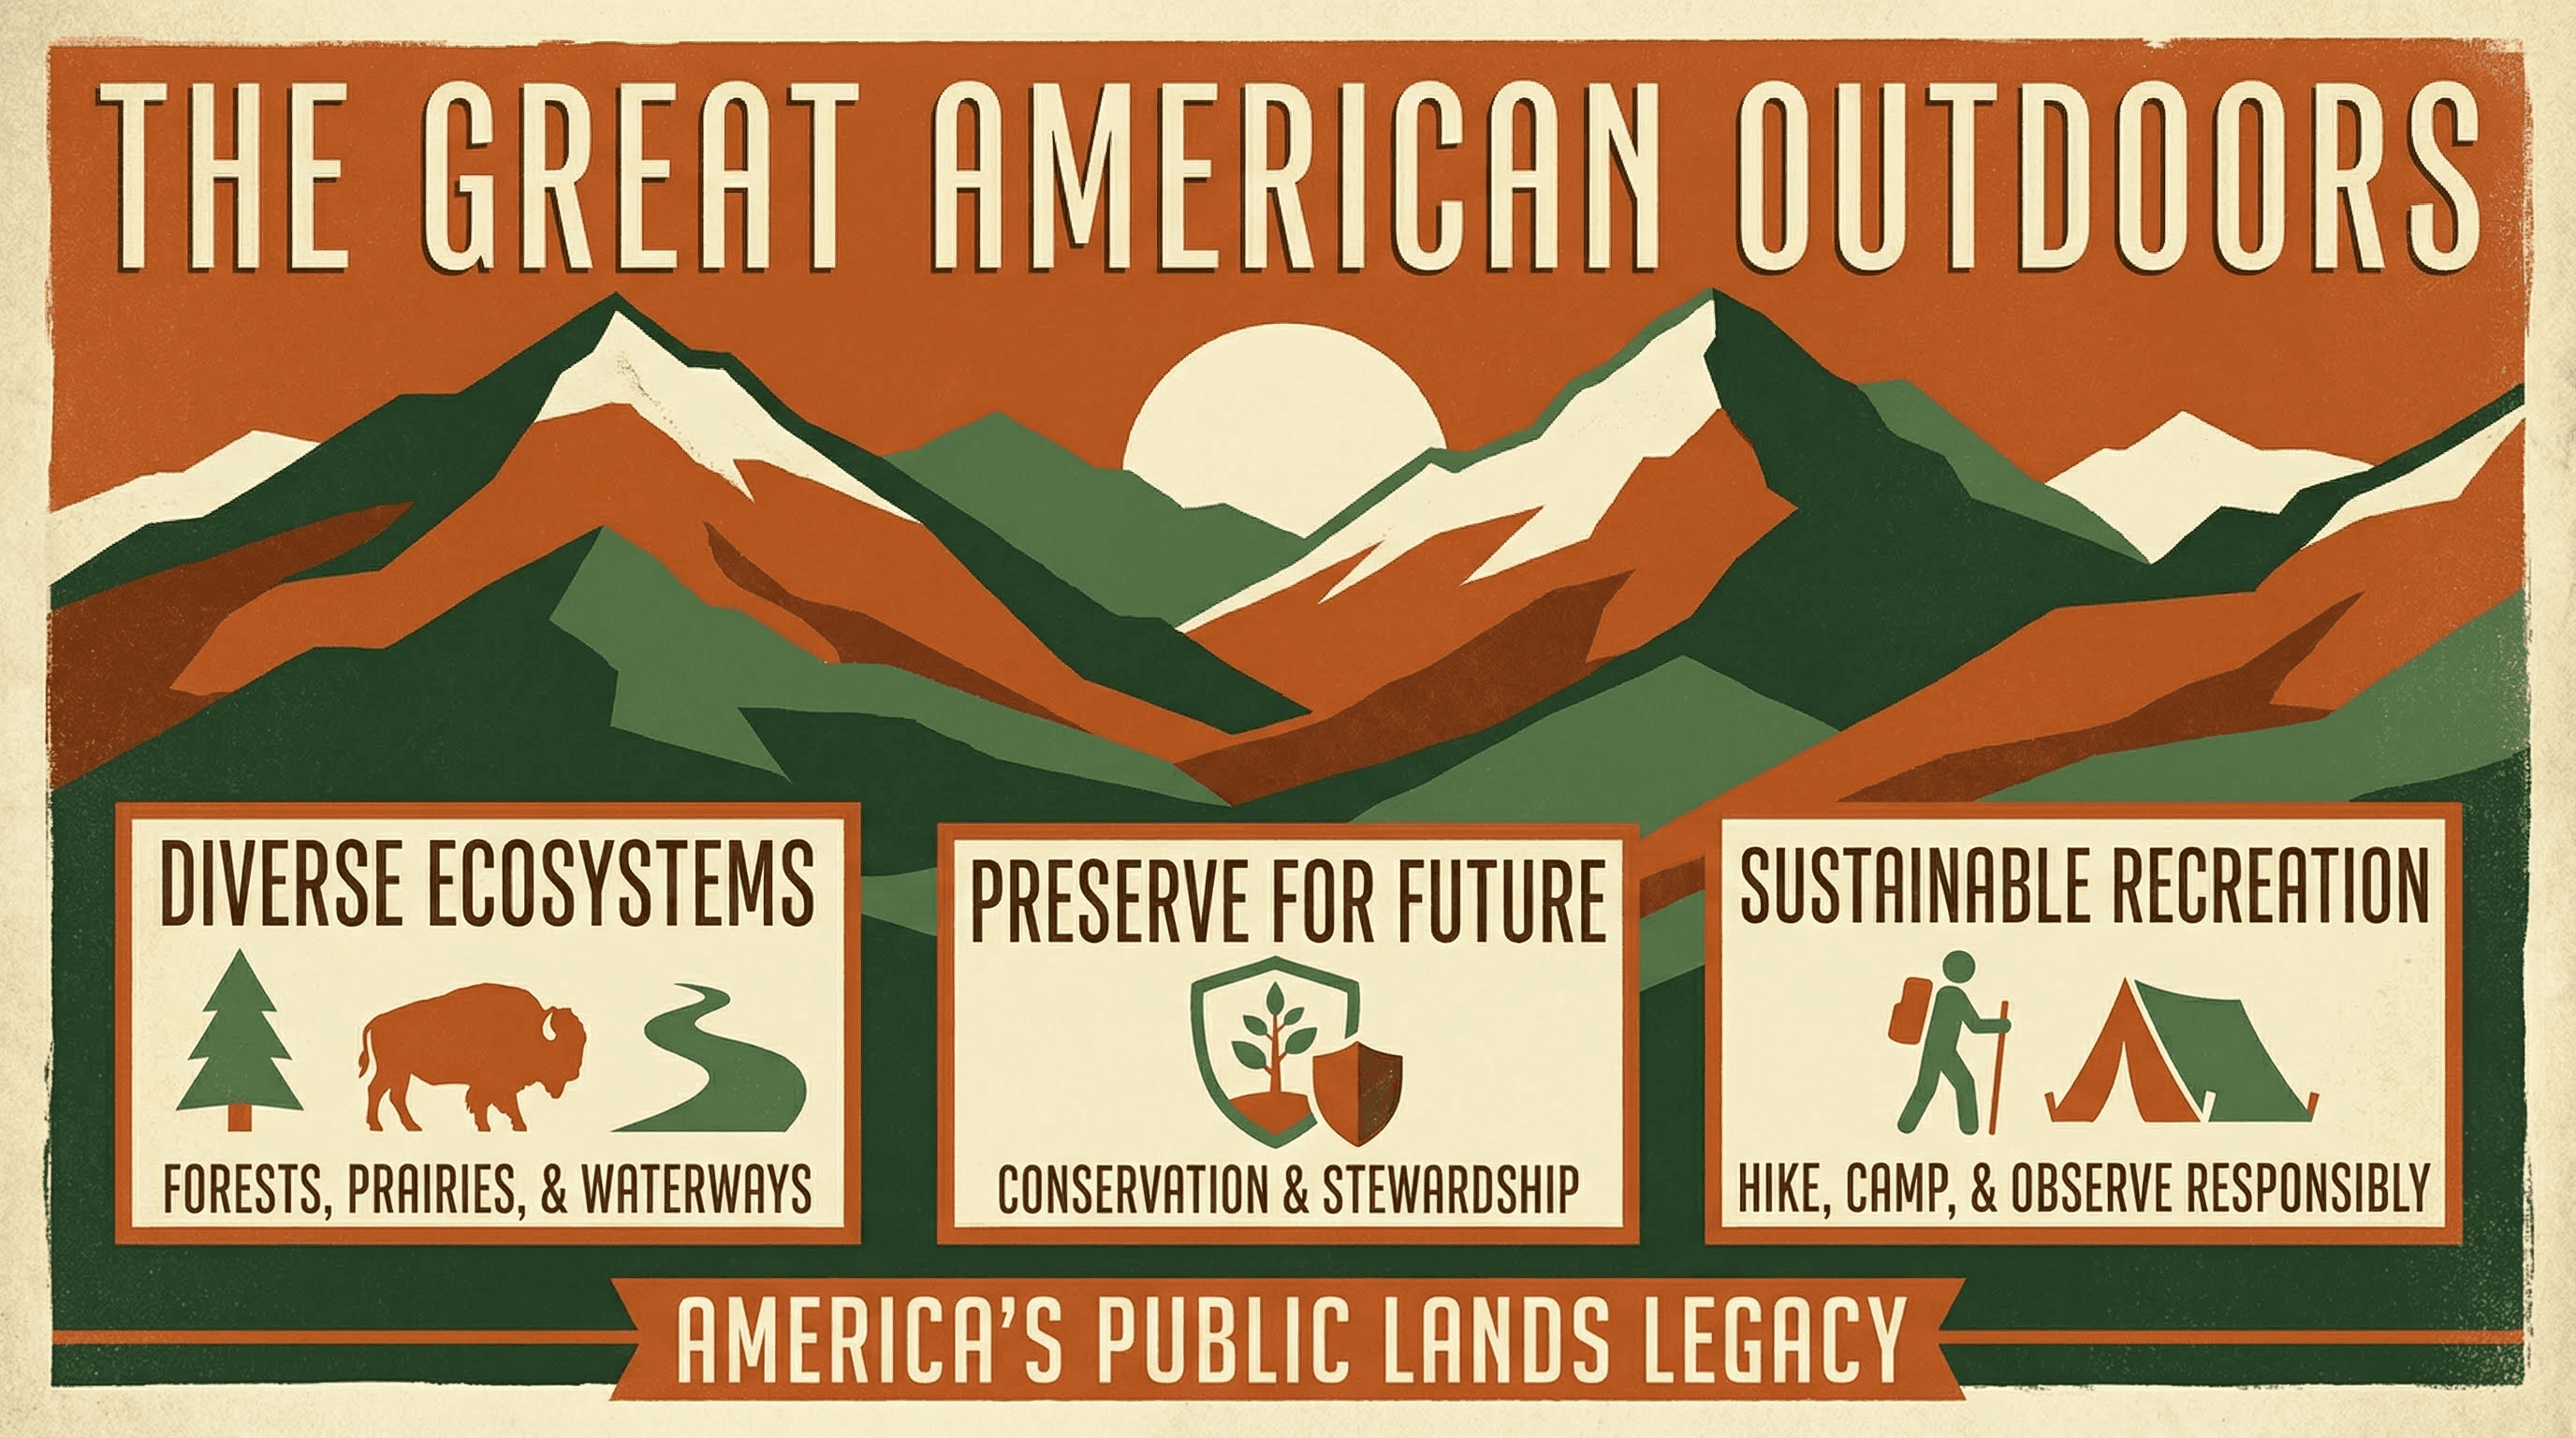
Style: Art Deco, National Parks, WPA style.
Design a vintage travel poster infographic for [TOPIC]. Style: WPA National Park poster aesthetic. Visuals: Screen-printed texture, flat broad colors, bold geometric mountains or landscapes. Typography: Tall, condensed Art Deco lettering. Palette: Earthy oranges, forest greens, and cream.
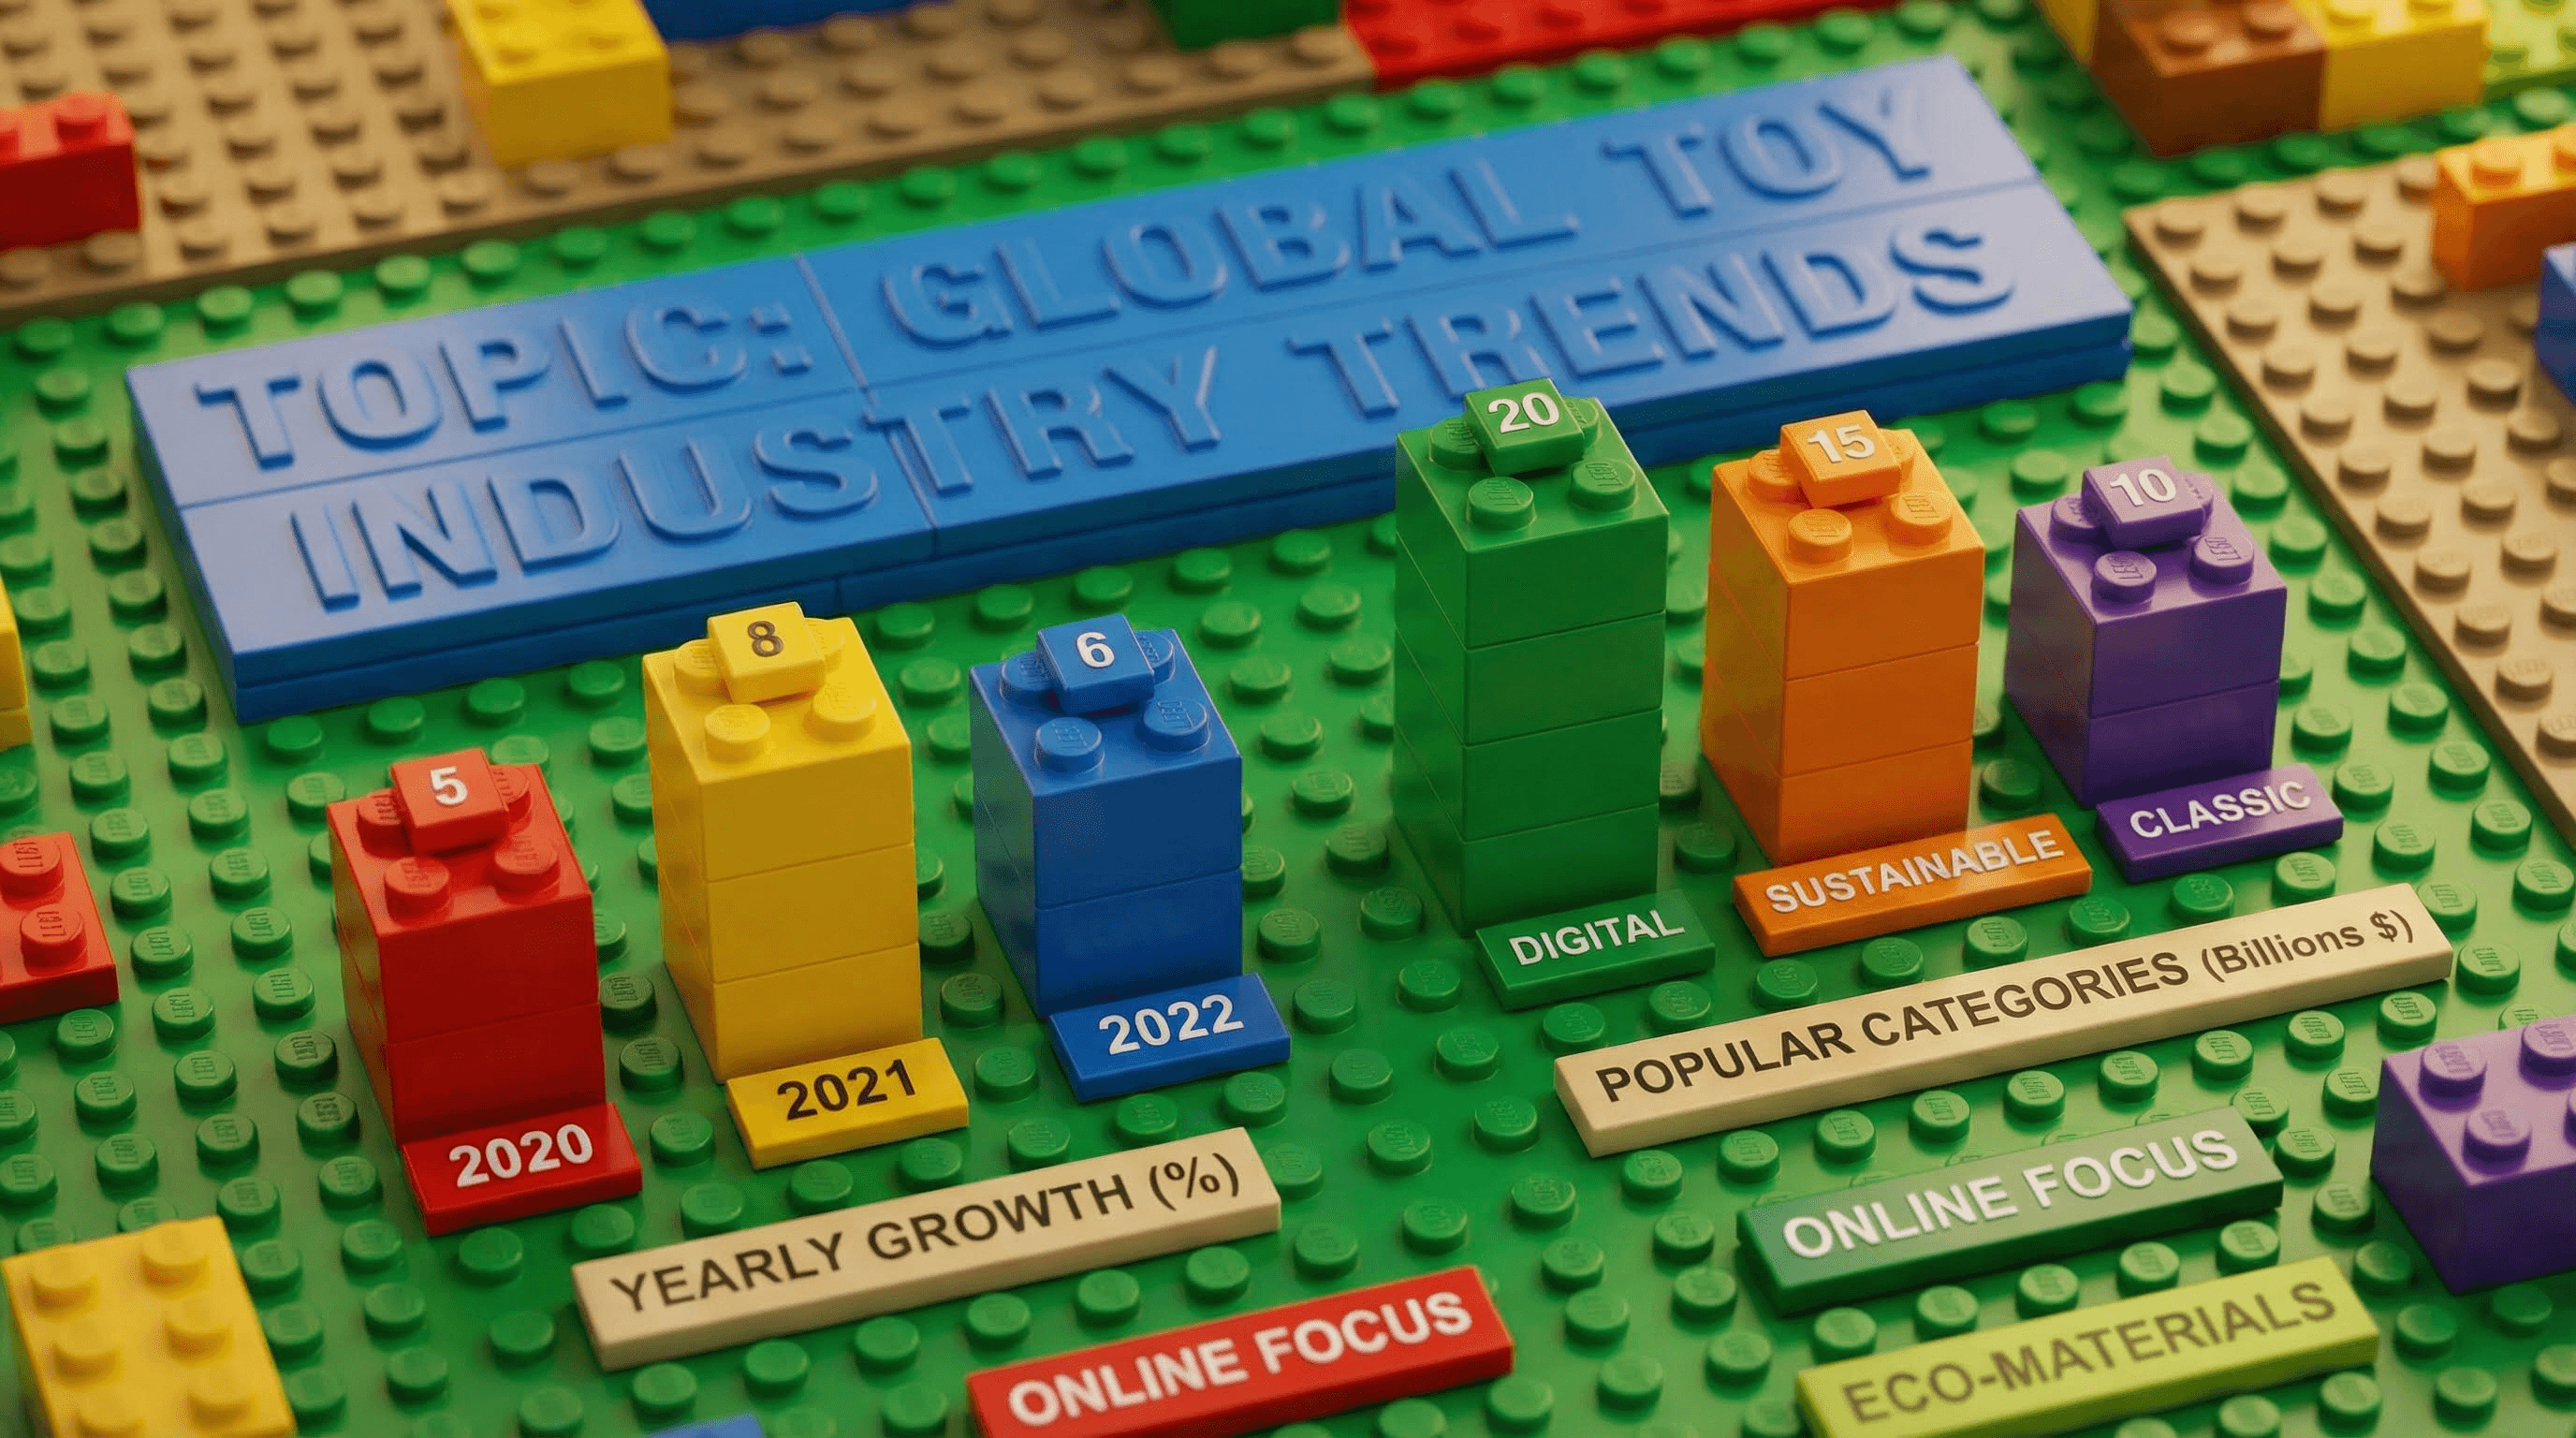
Style: Plastic bricks, toy photography, playful.
Create a brick-built infographic for [TOPIC]. Visuals: All elements constructed from plastic toy bricks. Charts: Bar charts made of stacked bricks. Background: Plastic baseplate. Lighting: Macro toy photography style with depth of field. Text: Embossed on smooth tiles.
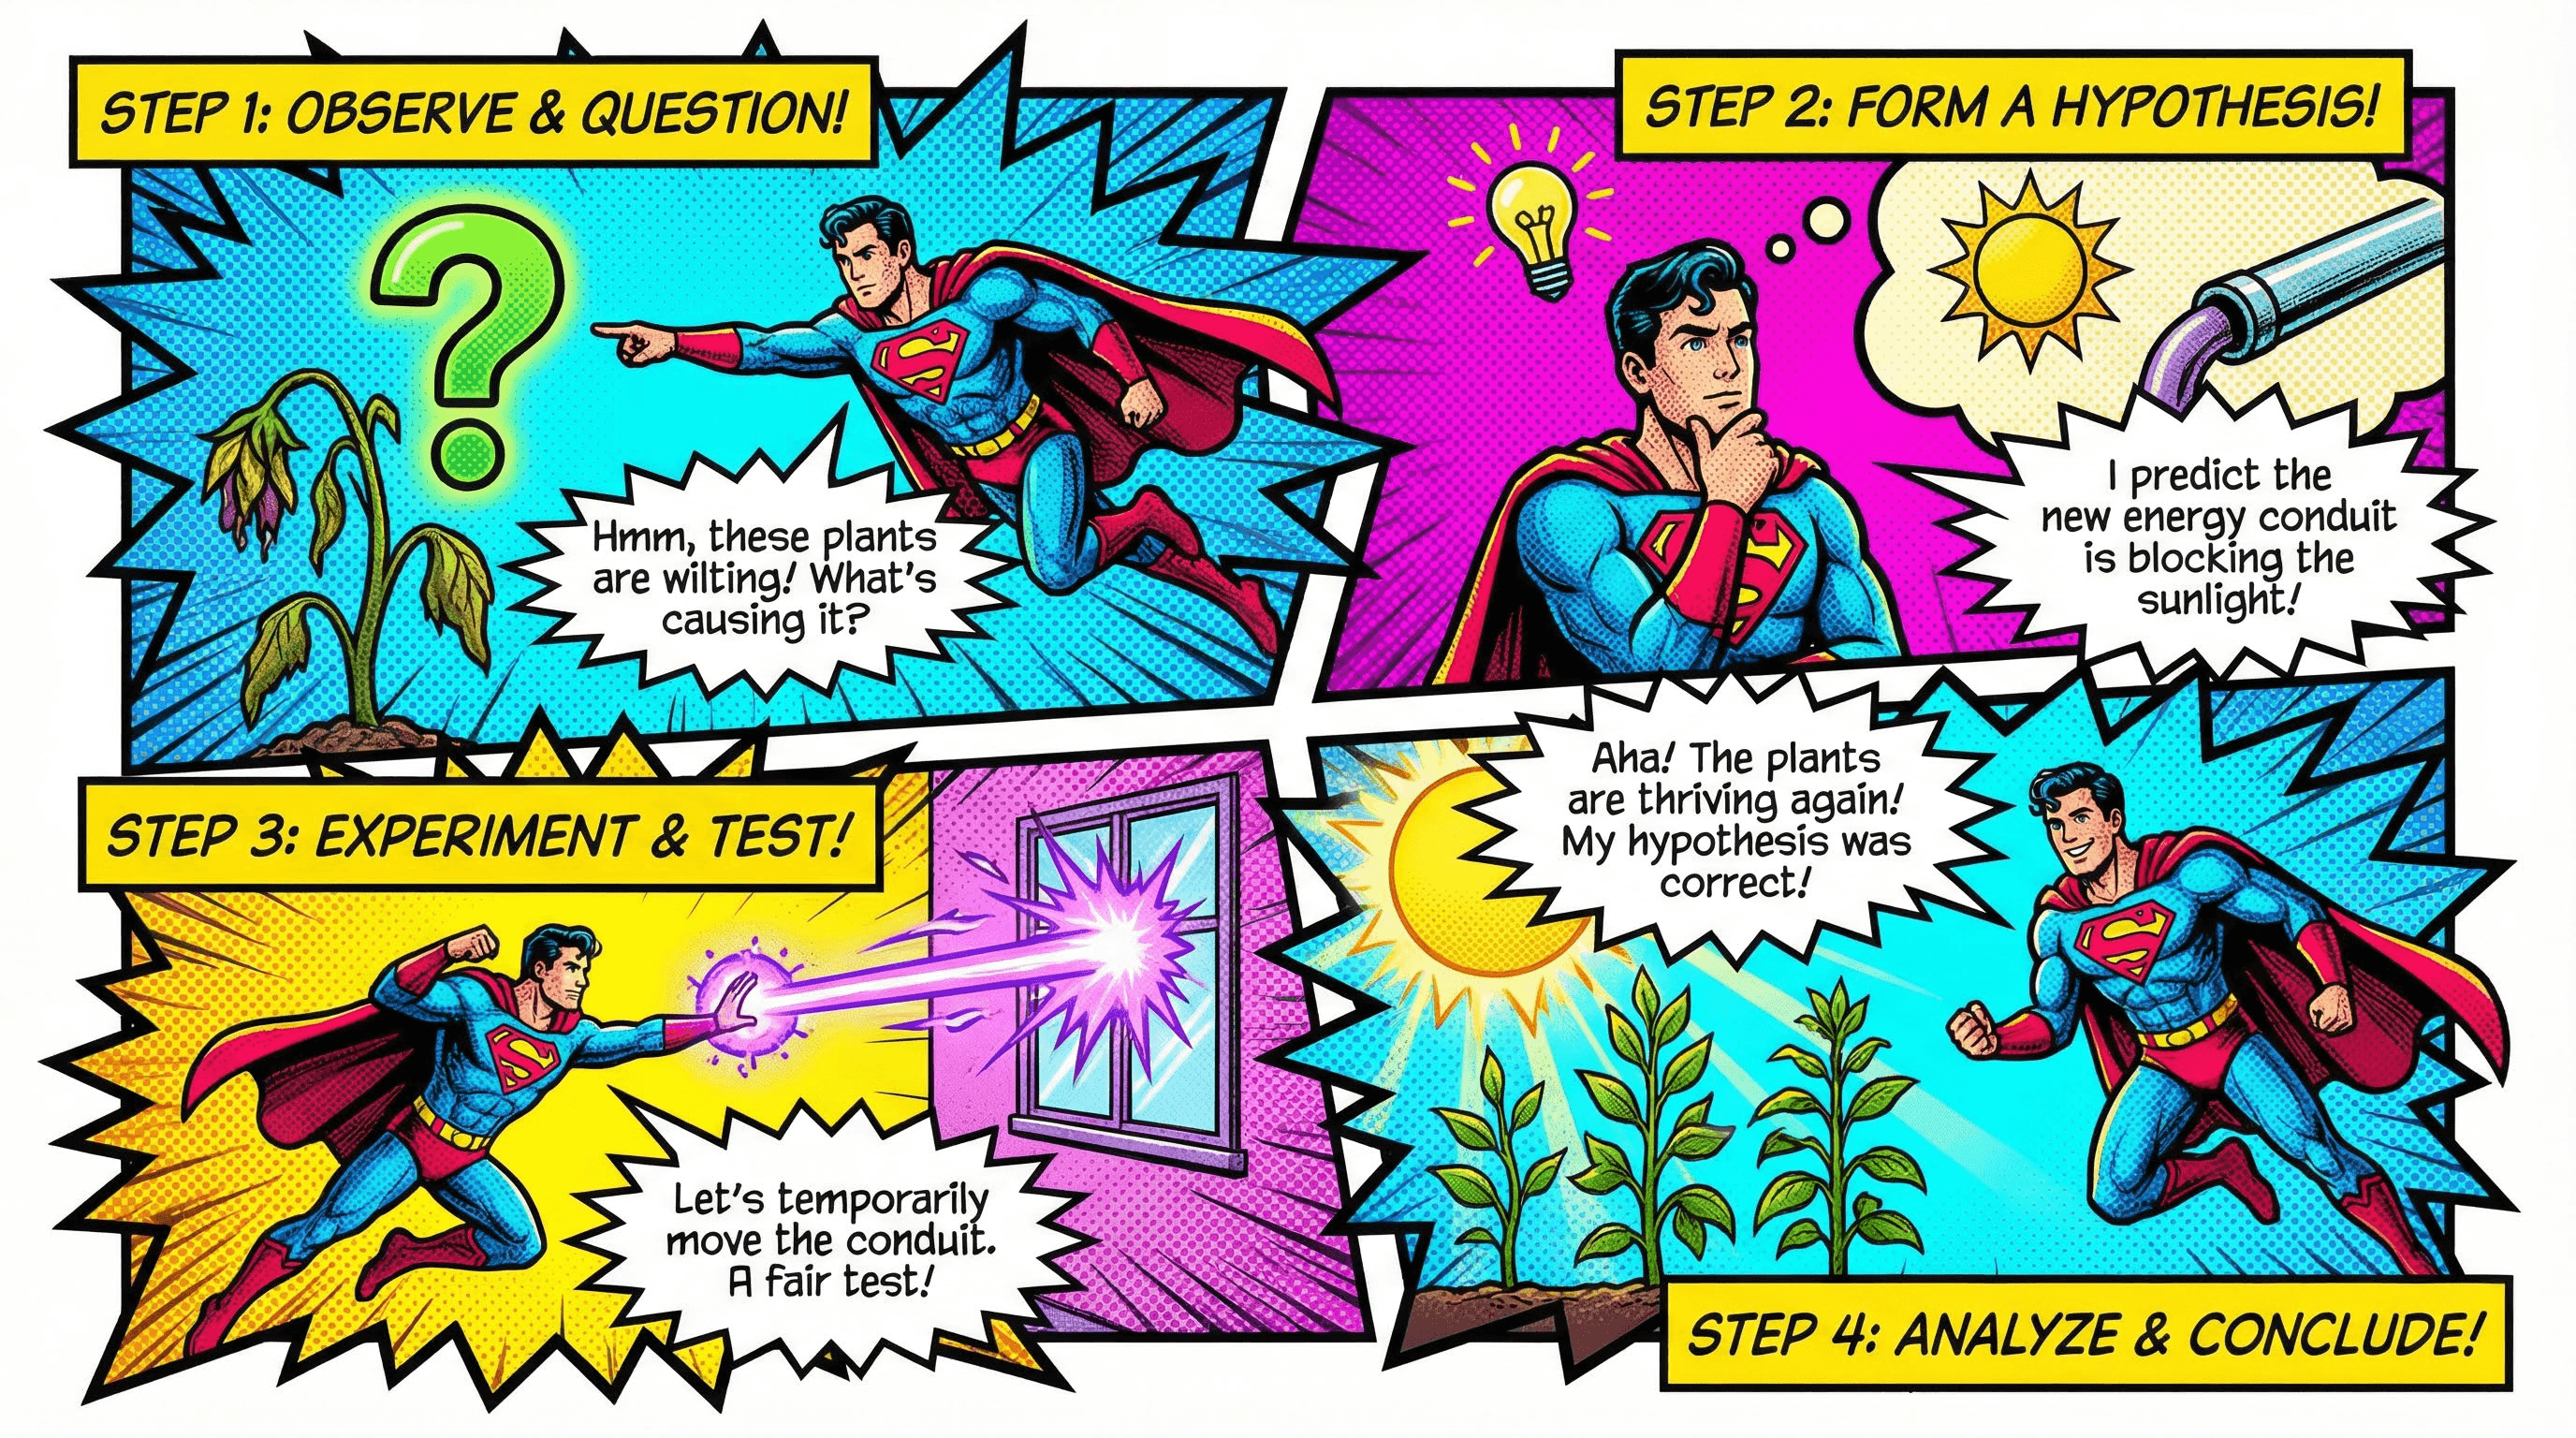
Style: Vintage Marvel/DC, halftone dots, dynamic action.
Design a comic book page infographic for [TOPIC]. Layout: Dynamic panels with jagged borders. Visuals: Superhero character demonstrating the concept. Text: Inside speech bubbles and yellow narration boxes. Style: Halftone dot shading, bold black outlines, vibrant primary colors (CMYK).
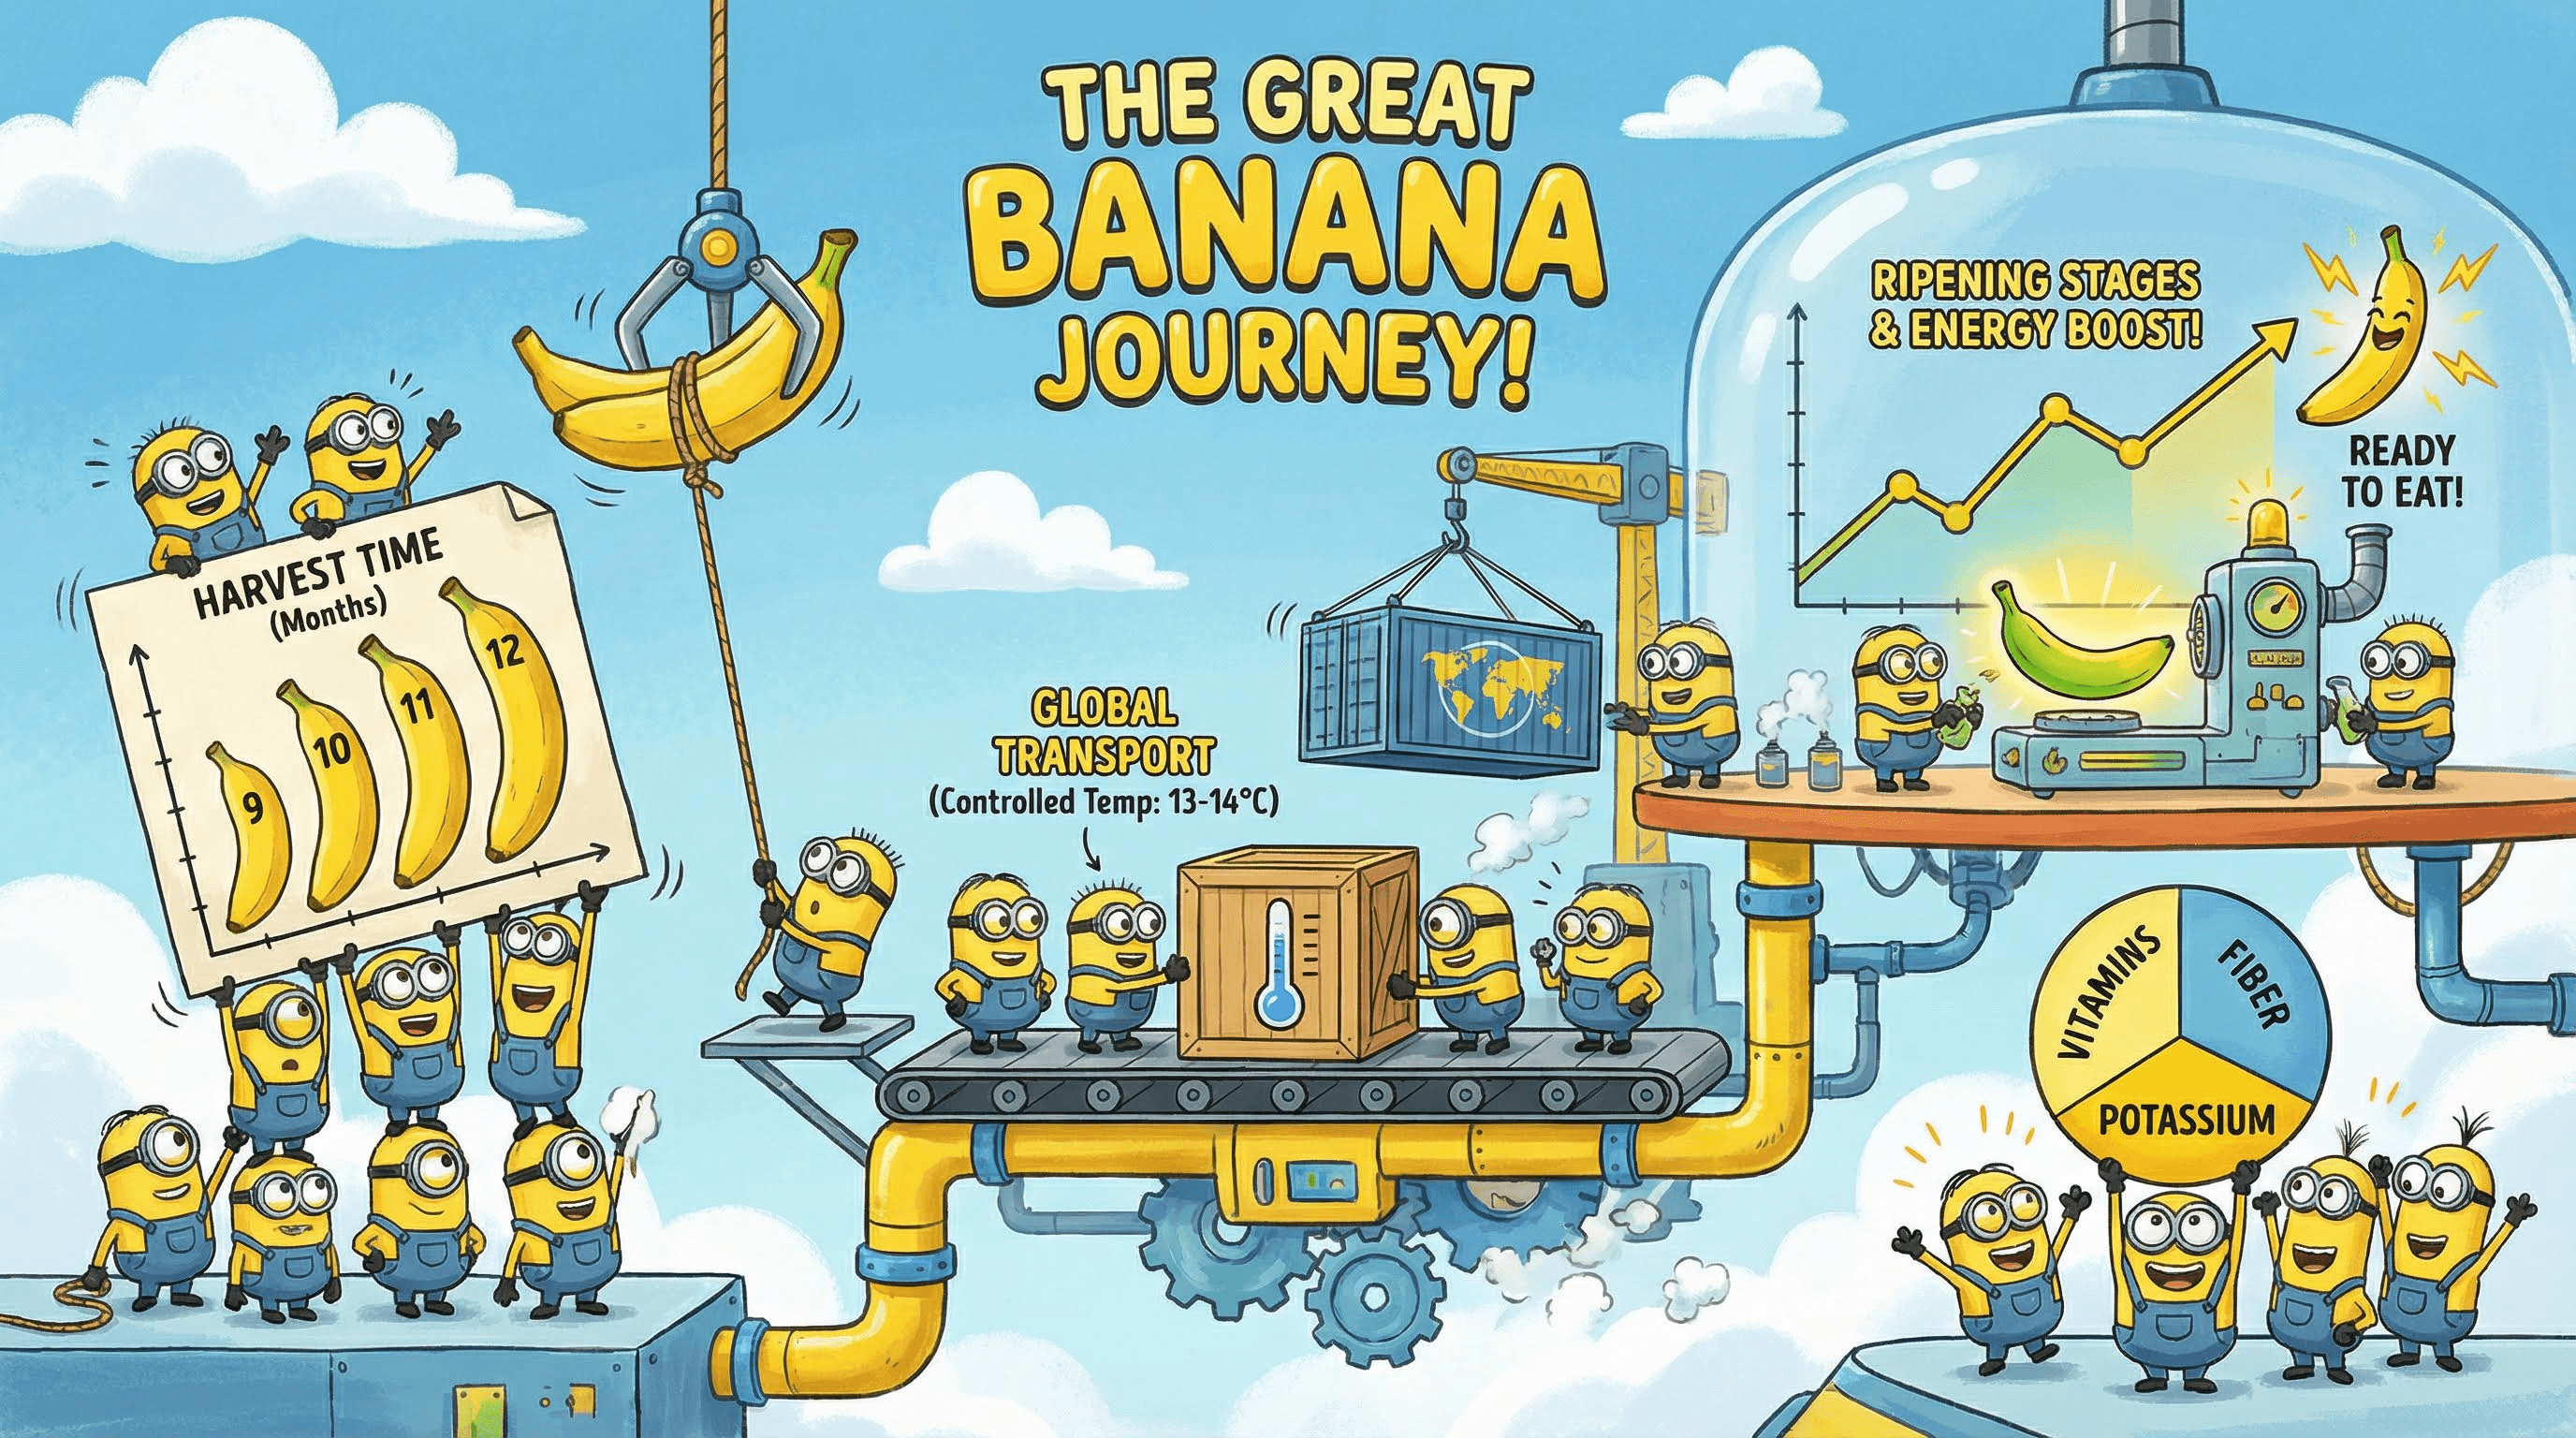
Style: Animated movie, yellow helpers, chaotic fun.
Create a fun animated movie style infographic for [TOPIC]. Visuals: Small yellow capsule-shaped characters with goggles and denim overalls assisting with the data. Mood: Playful and energetic. Layout: The characters are holding up the charts or building the graphs. Background: Industrial lab or bright blue sky. Colors: Banana yellow and denim blue.
Style: Plasticine, stop-motion, handmade texture.
Design a claymation style infographic for [TOPIC]. Visuals: All elements look like hand-sculpted plasticine clay with visible fingerprints. Lighting: Soft studio lighting with realistic shadows. Text: Formed from rolled-out clay snakes. Background: Cardboard set design. Mood: Whimsical and tactile.
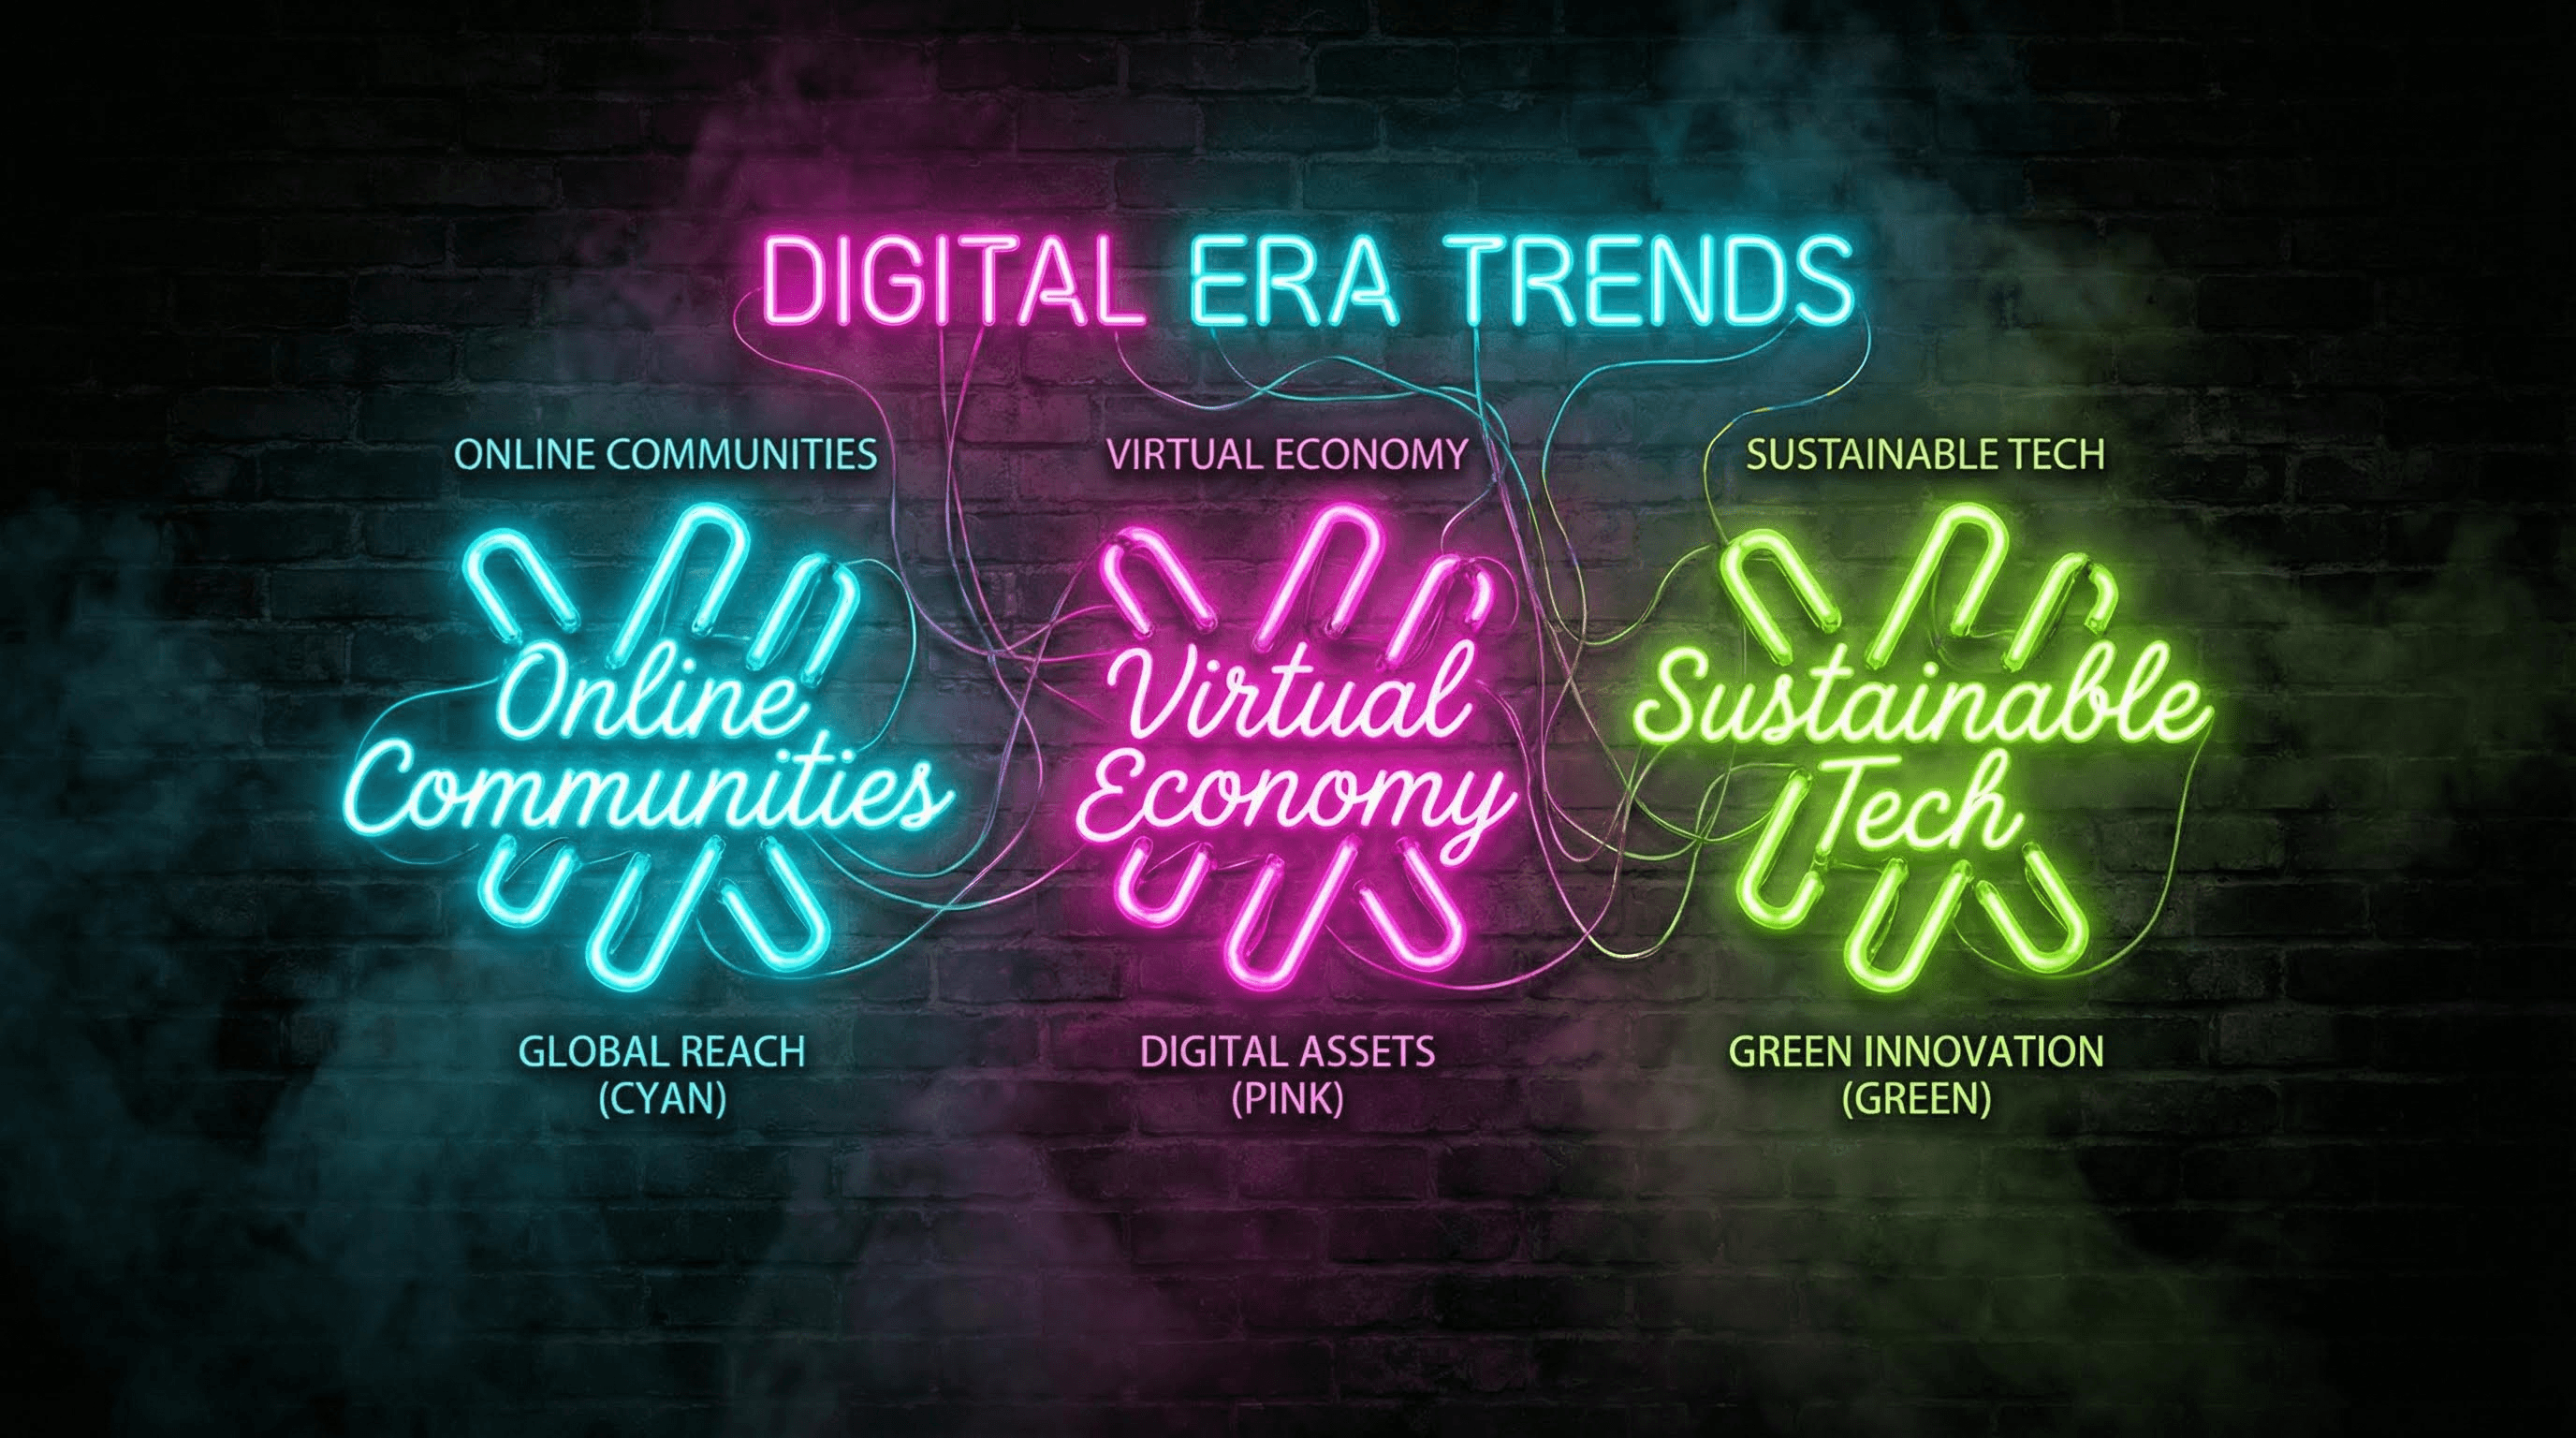
Style: Cyberpunk, Las Vegas, glowing tubes.
Generate a neon sign infographic for [TOPIC]. Background: Dark brick wall texture. Visuals: Data points represented by glowing glass neon tubes. Colors: Electric pink, cyan, and lime green. Text: Cursive neon typography connected by wires. Atmosphere: Smoky, noir, high contrast.
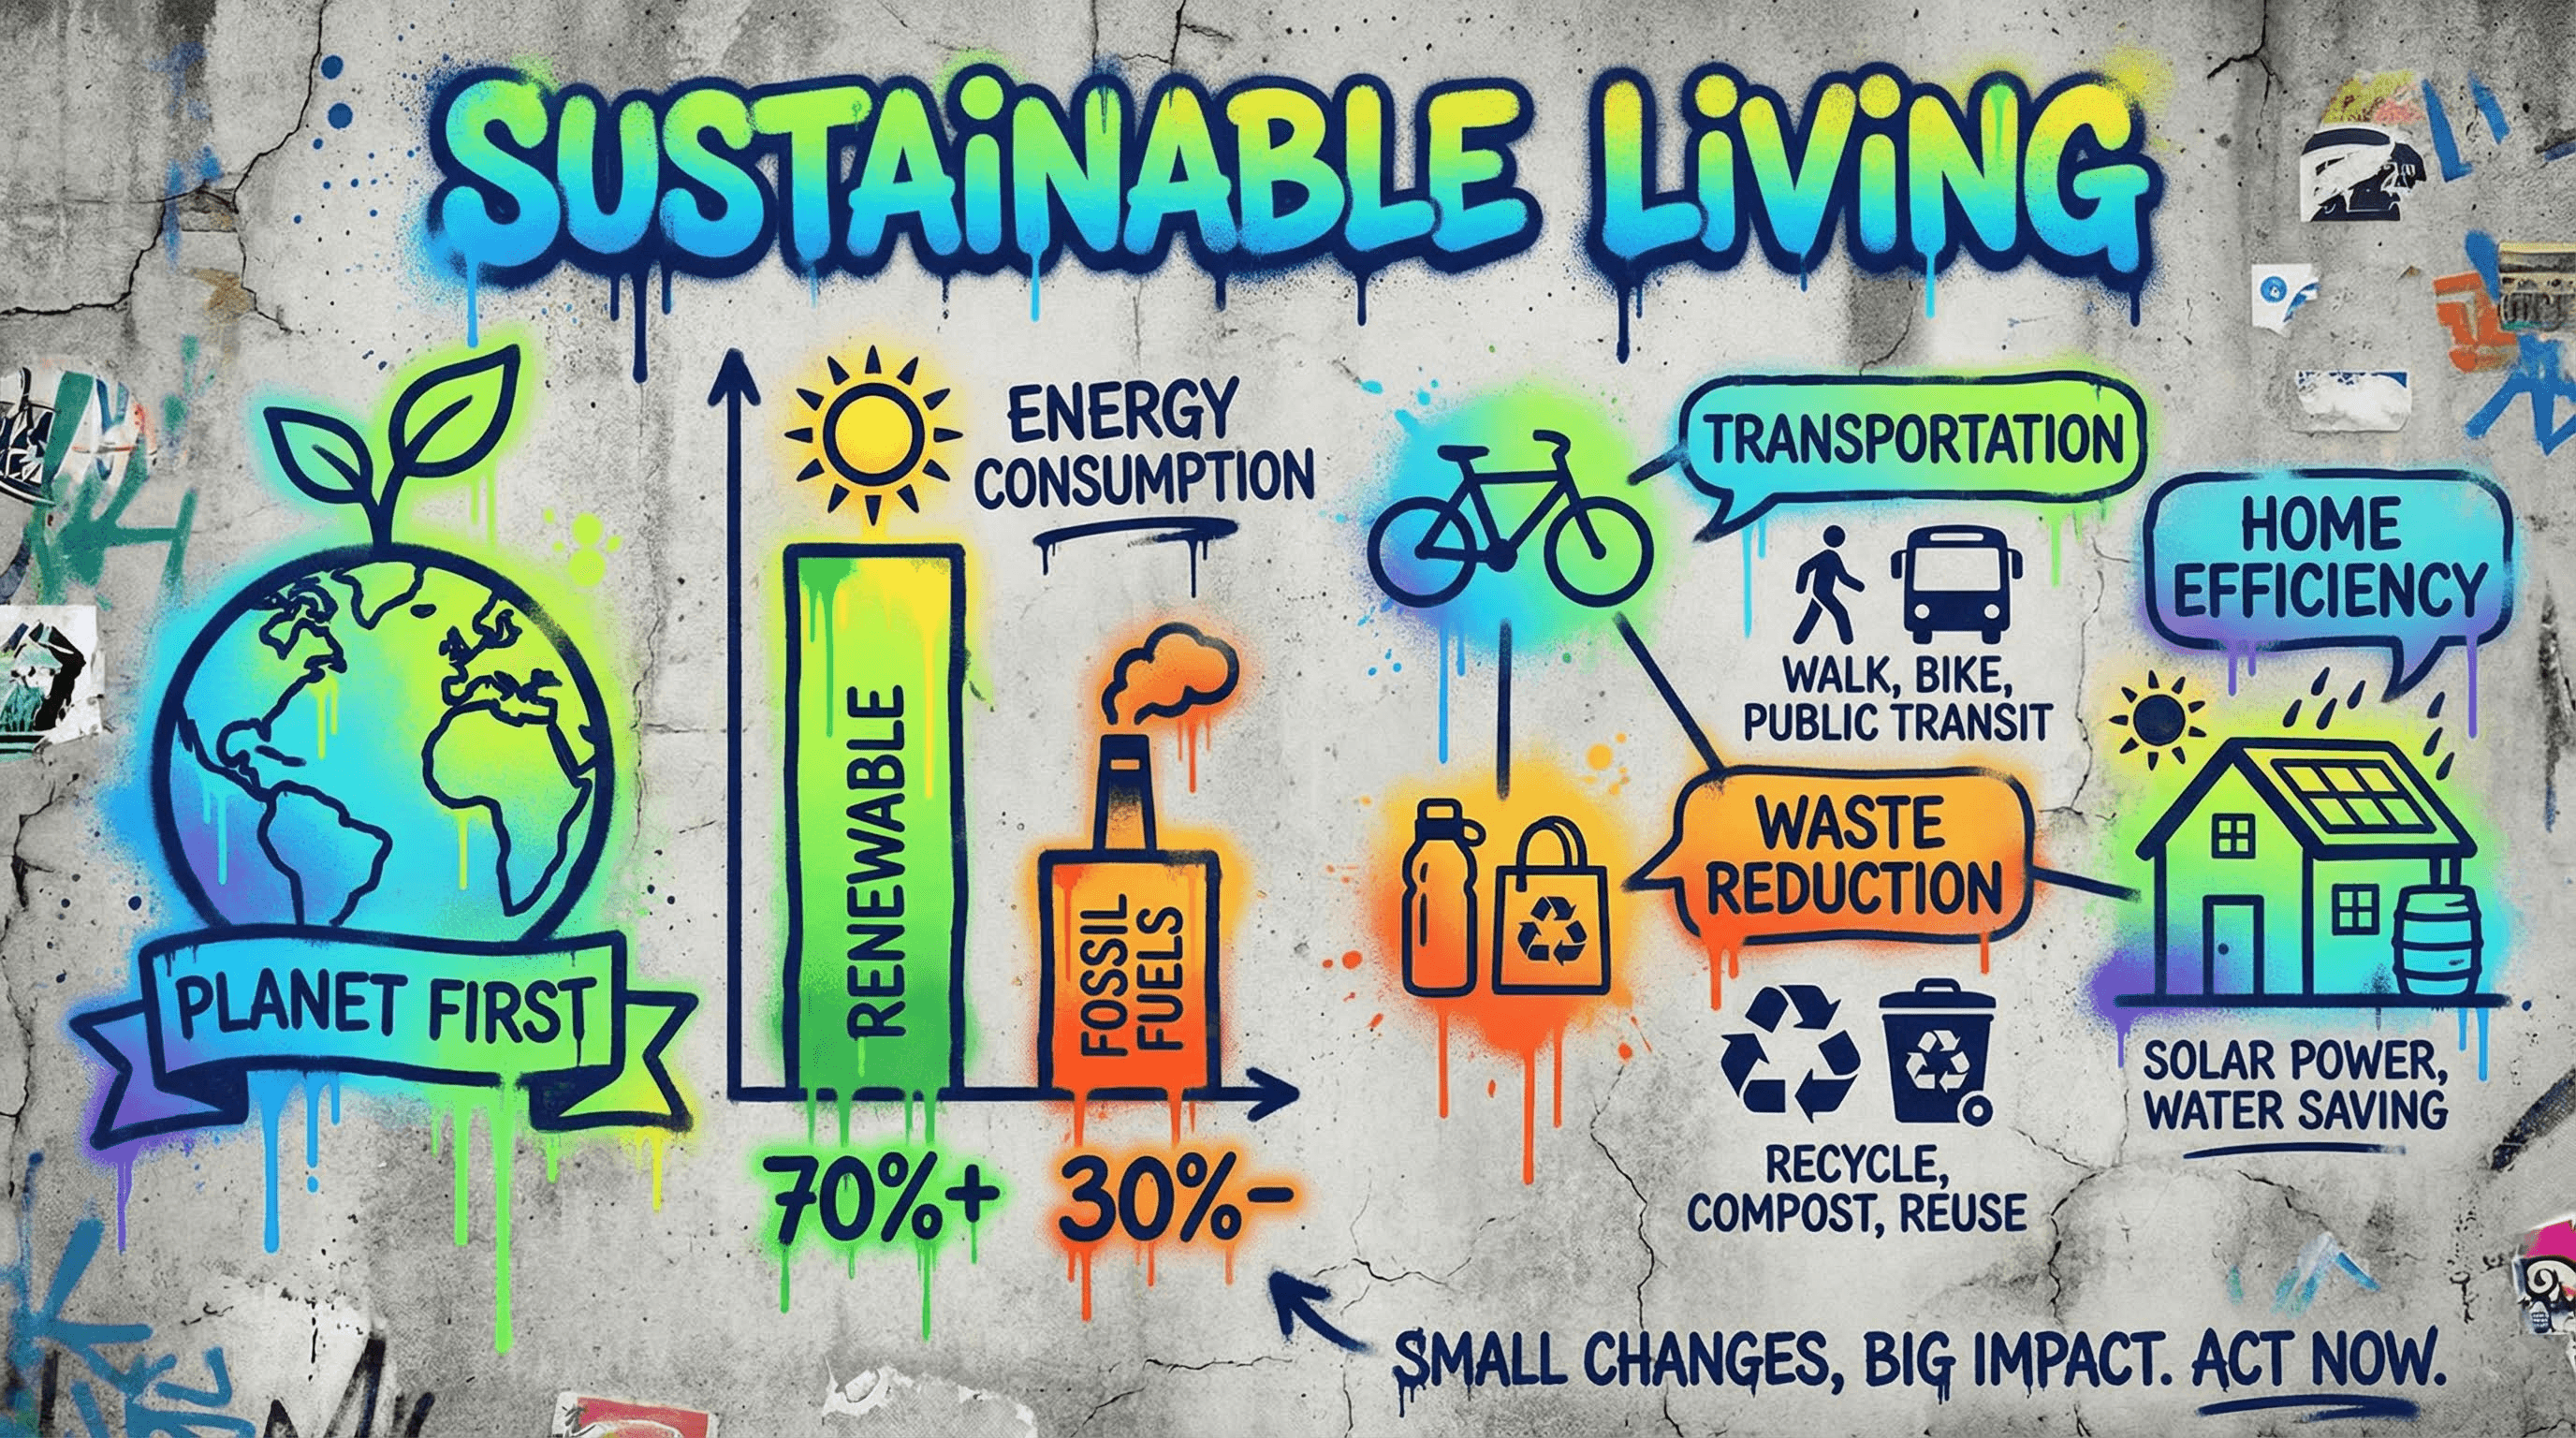
Style: Street art, spray paint, urban.
Create a street art graffiti infographic for [TOPIC]. Background: Concrete urban wall texture. Visuals: Spray-painted stencils and murals representing the data. Charts: Dripping paint style bars. Text: Bubble letters or tag-style typography. Palette: Vibrant aerosol colors against gray concrete.
Golden Rules for Gemini Infographics
To get the most out of these prompts, keep these three expert tips in mind:
Aspect Ratio Matters: By default, Gemini generates squares. For infographics, almost always append --ar 9:16 (for mobile/Pinterest) or --ar 16:9 (for presentations) to your prompt if the platform allows, or specify Vertical Layout clearly in the text prompt.
The 400-Word Limit: To ensure near-perfect text rendering (99%+ accuracy), try to keep the total amount of text in your image prompt under 400 words. Going over can sometimes lead to hallucinations or garbled text.
The Spelling Check: Gemini is great at spelling, but not perfect. If it misspells a headline, don't throw the image away. Use the internal In-painting or Edit tool to highlight the text area and type: Correct text to read: [Correct Spelling].
Ready to start creating?
At Atlabs AI, we are constantly exploring the edge of generative design. Use these prompts to save hours of work and create visuals that actually tell a story.
Head Over to Atlabs and generate your Inforgrpahic using Nano Banana Pro.