
For the performance marketer who has been told CTV works but still cannot prove it to the CFO.
Your last-click attribution model is giving CTV exactly zero credit.
Your brand team is calling it an awareness play. Your media agency is reporting on reach and frequency. And your CFO, who approved a $200K upfront, is asking why none of this shows up in the pipeline dashboard.
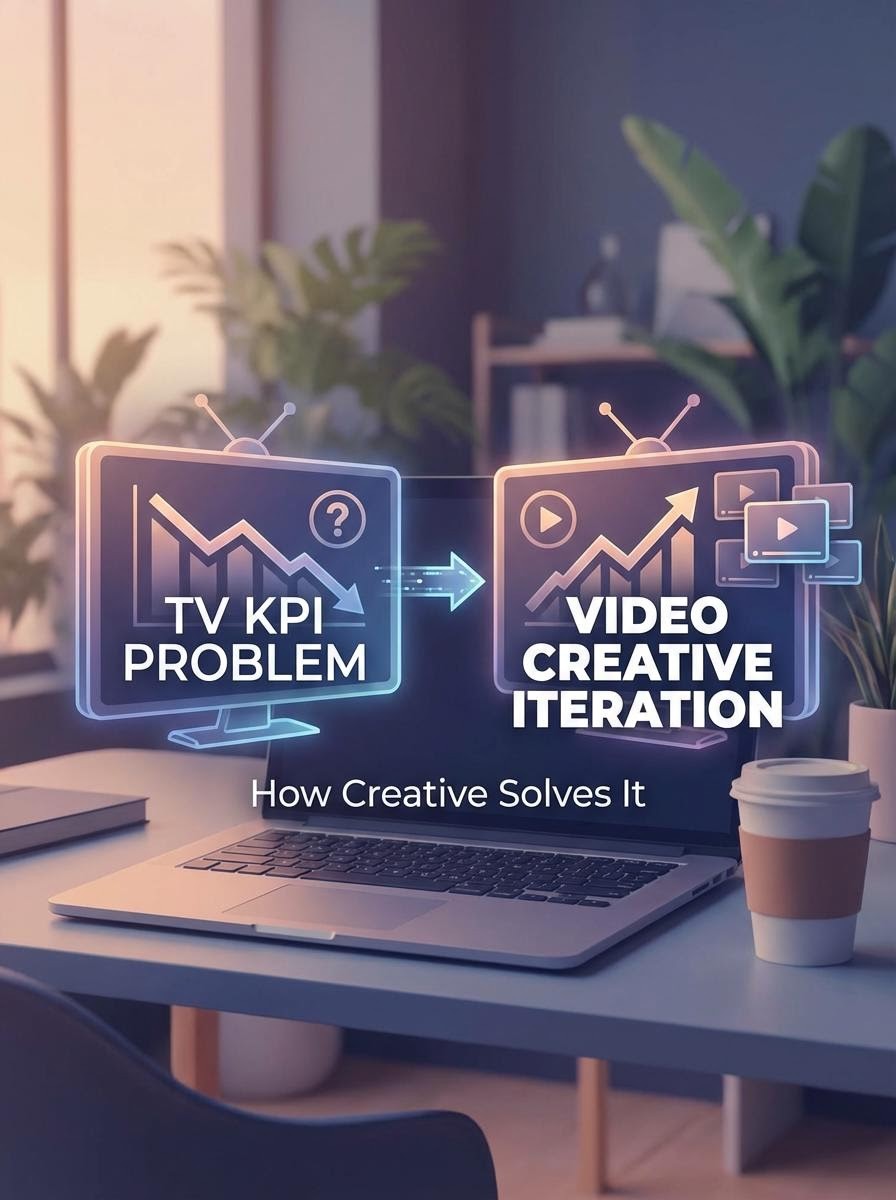
This is the performance TV measurement problem. And most marketers are walking into it without a framework.
But here’s the part nobody talks about: the measurement gap isn’t just a tracking problem. It’s a creative problem. The teams that are actually proving CTV ROI aren’t doing it with better attribution tools alone. They’re doing it by iterating faster on creative: running more variants, testing different emotional angles, and cutting new versions of spots in days, not quarters.
This guide breaks down both sides: how to build a KPI framework that makes CTV defensible, and how fast video creative iteration is the unlock most teams are missing.
Why Performance TV KPIs Keep Breaking
The problem starts with how TV was measured for 50 years. Gross rating points. Reach. Frequency. These are supply metrics. They tell you how many eyeballs touched your ad, not what happened next.
Performance TV (meaning CTV, streaming, addressable linear) promised something different: the trackability of digital with the impact of television. And in theory, that’s true. You can target by household. You can match device graphs. You can track post-exposure site visits.
In practice, most enterprise teams are still fighting three very specific battles:
Battle 1: The last-click attribution trap
CTV almost never gets last-click credit. A viewer watches your ad on their smart TV on Tuesday evening. They search for your brand on Thursday morning. Google gets the conversion. CTV looks like it did nothing.
If your KPI framework runs on last-click logic, CTV will always lose. Even when it’s the reason the Thursday search happened.
Battle 2: The brand vs. performance org split
Brand teams measure CTV on awareness lift, recall, and share of voice. Performance teams measure on CPL, CPA, and pipeline. These aren’t just different metrics. They’re different worldviews. And when CTV sits at the intersection, neither team fully owns it, which means neither team fully defends it at budget review.
Battle 3: Creative volume is too low to learn anything
Traditional TV creative production runs on a quarterly or annual cycle. You brief an agency. They produce one or two spots. You run them for months. By the time you get any signal on what’s working, the campaign is over.
You can’t optimize what you can’t iterate. And most teams aren’t iterating because production takes too long and costs too much.
The KPI Framework That Actually Works for Performance TV
The teams getting this right have stopped trying to force CTV into last-click logic. Instead, they split their measurement into two buckets: signal metrics and business metrics. They treat them as separate but connected layers.
Signal metrics: the early indicators
These tell you whether the creative is doing its job before conversions follow:
Video completion rate (VCR): if viewers are bailing at 15 seconds, the hook is not working
Household reach at target frequency: are you hitting the right people enough times to build recall?
Site visit rate post-exposure: what percentage of exposed households visit your site within 7 days?
Branded search lift: does search volume for your brand name increase in exposed geos vs. control?
Engaged session rate: of those post-exposure visits, how many go deeper than the homepage?
Business metrics: the outcomes that matter to the CFO
These close the loop from exposure to revenue:
Incremental leads from exposed households (requires a measurement partner or media mix model)
CPA on incremental conversions: not all conversions, only those you can attribute to CTV exposure
Pipeline influence: how many deals that closed had CTV-exposed contacts somewhere in the journey?
ROAS via incrementality testing: running matched holdout groups against exposed audiences.
Incrementality Testing: The Measurement Upgrade Worth the Effort
If there’s one measurement investment worth making in 2026, it’s incrementality testing for CTV.
The setup: you work with your DSP or a measurement partner to create a holdout group of households that match your target profile but don’t receive your CTV ads. You run the campaign. You compare conversion rates between exposed and holdout groups. The delta is your incremental lift.
It’s not perfect. Holdout design has its own biases. But it’s the closest thing to a controlled experiment you can run at scale on a channel that doesn’t support last-click.
The teams that are winning CTV budget conversations are the ones who show up with incrementality data, not reach reports. “We drove a 14% lift in qualified trial starts among exposed households” lands differently than “we delivered 12M impressions at a 2.1 frequency.”
Why Creative Iteration Is the Hidden Lever
Here’s the thing most measurement discussions miss: the KPI framework only works if you have enough creative variation to learn from.
Running one 30-second spot for a quarter gives you one data point. You might learn that your CTV campaign drove 8% branded search lift. But you won’t know if a different emotional angle (product-led vs. story-led, problem-first vs. outcome-first) would have driven 18%.
The brands getting outsized CTV results are running 6 to 10 creative variants per quarter. Different hooks. Different voiceovers. Different visual treatments targeting different audience segments. They’re treating CTV creative like paid social creative: test fast, kill what doesn’t work, scale what does.
The problem? Traditional production makes this impossible. A single 30-second CTV spot (agency fees, production crew, post-production) costs anywhere from $15K to $80K and takes four to eight weeks. You can’t run ten variants a quarter on that economics.
What changes when you can produce a variant in a day
This is where AI-generated video production has quietly changed the math for performance marketers.
With a platform like Atlabs, a performance marketing team can take a proven script, swap the visual treatment, change the voiceover tone, reframe the opening hook, and generate a broadcast-quality variant in hours, not weeks. No agency retainer. No production crew. No render farm.
That changes what’s possible in the signal-metric layer of your KPI framework. When you can test whether a problem-focused hook drives higher site visit rates than a social-proof hook, and get that answer within a week of launching, you start building a real optimization loop.
The winning CTV playbook in 2026 looks like this:
Launch two to three creative variants per audience segment
Measure VCR and site visit rate by variant in the first two weeks
Double down on the variant driving the highest post-exposure engagement
Cut new variants that riff on the winning angle
Bring incrementality data to your quarterly budget review
You can’t run that playbook if each variant costs $40K and eight weeks. But you can run it when production is a same-day operation.
A Real Workflow: From Brief to CTV Variant in Under 3 Hours
Here’s how a performance marketing team would actually use Atlabs to support a CTV creative iteration workflow:
Step 1: Lock your winning script (15 minutes)
Start with the script that’s already been tested in paid social or YouTube pre-roll: the version where you know the messaging lands. CTV isn’t the place to test messaging from scratch. Test visual treatment against proven messaging.
Step 2: Define your variant hypotheses (20 minutes)
Based on your signal metrics from previous flights, decide what you’re testing. Common high-value variables:
Hook style: problem-first (“If your attribution model ignores CTV…”) vs. outcome-first (“Teams that prove CTV ROI do this one thing differently…”)
Emotional register: authoritative and direct vs. conversational and peer-to-peer
Visual treatment: live-action feel vs. motion graphics vs. cinematic AI-generated footage
Audience-specific cut: a variant that speaks directly to the CFO persona vs. the performance marketer persona
Step 3: Generate variants in Atlabs (60 to 90 minutes)
Feed your script into Atlabs. The platform breaks it into scenes and generates high-fidelity visual sequences: you can direct the visual style, pacing, voiceover tone, and motion treatment. Need a cinematic product reveal that would have cost $30K with a production crew? Generate it. Need a data-driven motion-graphics version for a CFO audience? Generate that too.
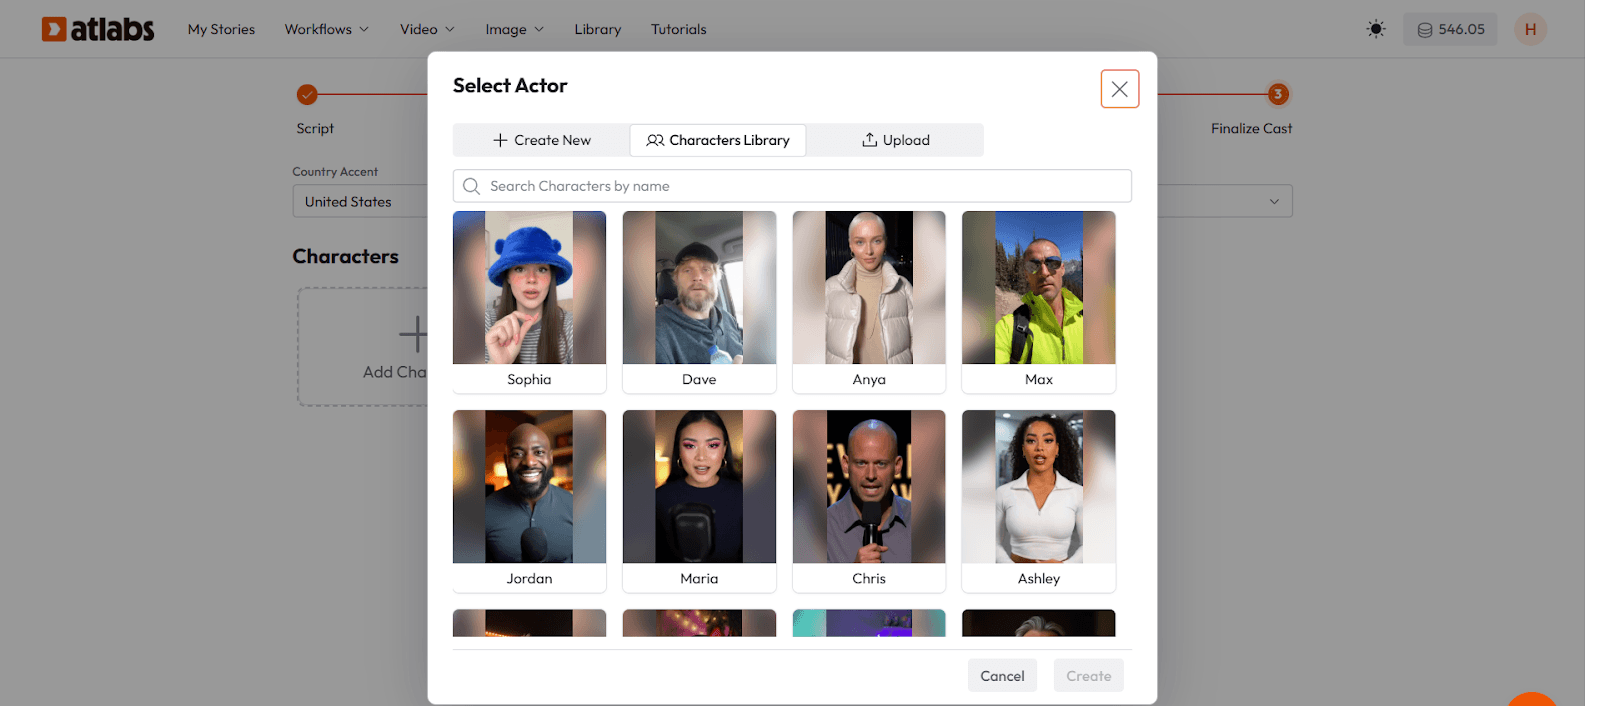
Atlabs supports 50+ visual styles and ultra-realistic AI voiceovers with automatic lip sync, so swapping the voice register between variants takes minutes, not a re-record session.
Step 4: Export and traffic to your DSP (30 minutes)
Export at the resolution your DSP or streaming platform requires. Atlabs supports up to 4K export and integrates with Premiere Pro for any final polish. Traffic your variants as you would any CTV creative.
Step 5: Read signal metrics at the two-week mark
Pull VCR, site visit rate, and branded search lift by variant. You now have actual data (not assumptions) about which creative angle is working with which audience.
Two-week creative data beats six months of single-variant gut instinct every time.
How to Talk About This in Your Next Budget Review
If you’re heading into a CTV budget conversation, here’s the framing that works:
Don’t lead with impressions. Lead with signal metrics that connect to business outcomes. Here’s a structure that CFOs and growth leaders respond to:
The exposure layer: We reached [X] households in our ICP at [Y] frequency during [time period].
The engagement signal: Site visit rate among exposed households was [Z]%, compared to a [benchmark] baseline. Branded search lift in exposed DMAs was [N]% vs. control.
The incremental outcome: Using a holdout methodology, we attribute [N] incremental trials / leads / pipeline deals to CTV exposure during the quarter.
The creative learning: Variant B (outcome-first hook, CFO-targeted voiceover) drove 2.3x the site visit rate of Variant A. We’re scaling Variant B in Q3 and testing two new hooks against it.
That last point (the creative learning) is what separates teams that get CTV budget renewed from teams that watch it get reallocated to paid search. You’re not just reporting on what happened. You’re showing a compounding optimization loop.
The Creative Velocity Advantage
There’s a compounding effect that most teams underestimate.
The first quarter you run a CTV iteration workflow (multiple variants, signal metrics, holdout testing) you generate a small edge. You learn which hooks perform. You cut waste. You optimize toward incrementality.
The second quarter, you start from a better baseline. Your creative hypotheses are informed by real data. Your variants are tighter.
By the fourth or fifth quarter, you’ve built something that looks less like a campaign and more like a learning engine. Your cost per incremental conversion is dropping. Your creative team knows which emotional angles move your specific audience. You’ve built a competitive moat that can’t be replicated by a competitor who’s still running one spot per quarter.
This is the advantage that fast creative production unlocks. Not just cheaper ads. Faster learning.
The Bottom Line
Performance TV has a real measurement problem. Last-click attribution wasn’t built for it. Brand and performance teams aren’t aligned on what success looks like. And most campaigns don’t generate enough creative variation to actually learn.
But teams that solve all three (a dual KPI framework, incrementality testing, and high-velocity creative iteration) are consistently the ones winning CTV budget renewals and proving channel ROI.
The measurement framework is the what. Creative iteration is the how.
If your team is still on a one-spot-per-quarter production cycle, Atlabs is worth exploring. Generate your first CTV variant today and see how quickly the math changes when production is not the bottleneck.
Start creating performance TV creative with Atlabs → app.atlabs.ai